---
title: "Taxing Agency Recapture Funds"
format:
html:
code-fold: true
toc: true
tbl-cap-location: margin
fig-cap-location: margin
df-print: paged
---
```{r warning = FALSE, message = FALSE, include=FALSE}
knitr::opts_chunk$set(warning = FALSE, message = FALSE)
options(scipen=999)
library(tidyverse)
library(ptaxsim)
library(DBI)
library(data.table)
library(ggrepel)
library(readxl)
is.integer64 <- function(x){
class(x)=="integer64"
}
cmap_colors = c("#1e478e", "#6dae4f", "#d3b42b", "#008fd5", "#ca3428",
"#ade0ee", "#3e6730", "#d0e4a4")
alea_theme <- function() {
font <-"Whitney"
ggplot2::theme(
legend.position = "bottom",
# legend.title = element_blank,
panel.background = ggplot2::element_blank(),
panel.grid.minor.x = ggplot2::element_blank(),
panel.grid.major.y = element_line(color = "grey"),
panel.grid.minor.y = element_line(color = "grey",
linetype = "dashed"),
# panel.grid.major.x = ggplot2::element_blank(),
axis.ticks = element_line(color = "gray"),
axis.ticks.x = element_blank()
)
}
```
## Summary of UIC GFRC’s Research on the Recapture Provision of the Property Tax Extension Limitation Law
The research team was asked to examine whether the recently introduced recapture provision created significant problems in property tax administration in Cook County.
### What is the Recapture Provision?
Property tax refunds arise from three sources: certificates of error, decisions of the Property Tax Appeal Board (PTAB), and, in rare cases, Circuit Court orders.
In 2021, Illinois amended its Property Tax Extension Limitation Law (PTELL) to account for the potential effect of these property tax refunds. The amendment, called the Recapture Provision, increases a taxing agency’s levy by the amount paid out by that agency the prior year in property tax refunds. The percentage increase in the tax rate is equal to refund’s share of the levy. This means that a refund equal to 5% of the levy will increase the tax rate by 5%.[^1] This levy increase is automatic unless the taxing agency decides to forego the increase.
[^1]: For example, assume that the original levy is \$100, the tax rate is 2% and the tax base is \$5000 and that a refund of \$5 is required. The new tax rate will be 2.1% because 2.1%\*5000=105 so that the new levy will be just sufficient to provide additional revenue sufficient to pay the refund.
### What the data show (2021 – 2023)
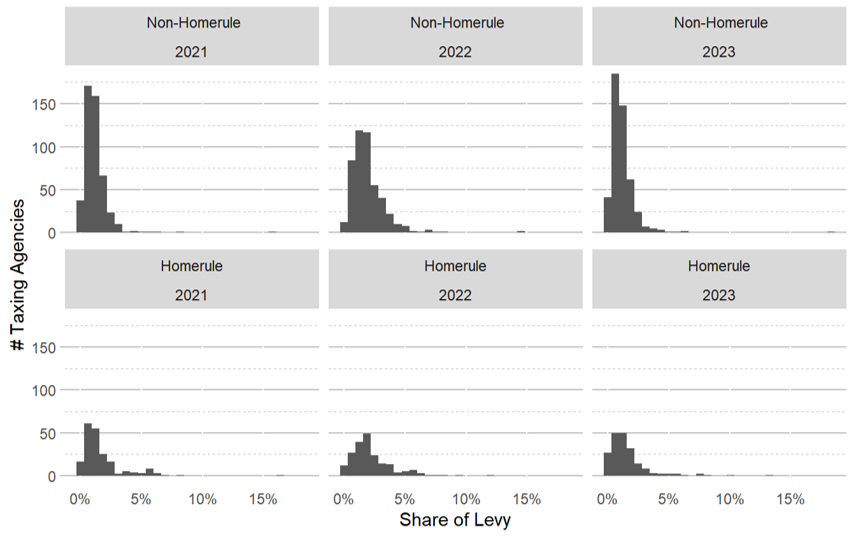
While only a few years of data are available, three trends have emerged. First, no agency has opted out of the recapture provision thus far. Second, property tax refunds are equal to less than 5% of levies for the vast majority of agencies. In 2021 and 2023, 95% of agencies had refunds less than 3% of their levy, and 95% of agencies had refunds less than 5% of their levy in 2022.
For 95% of the agencies eligible for recapturing refunds, the Recapture Provision added less than 0.2 percentage points to their tax rates. The agencies that recaptured the largest shares of their levies were often special purpose agencies such as park or library districts that generally have relatively low tax rates and have small dollar levies. This mitigated the effect of the recapture provision on composite rates. Figures 1 and 2 provide more detailed information about the distribution of refunds.
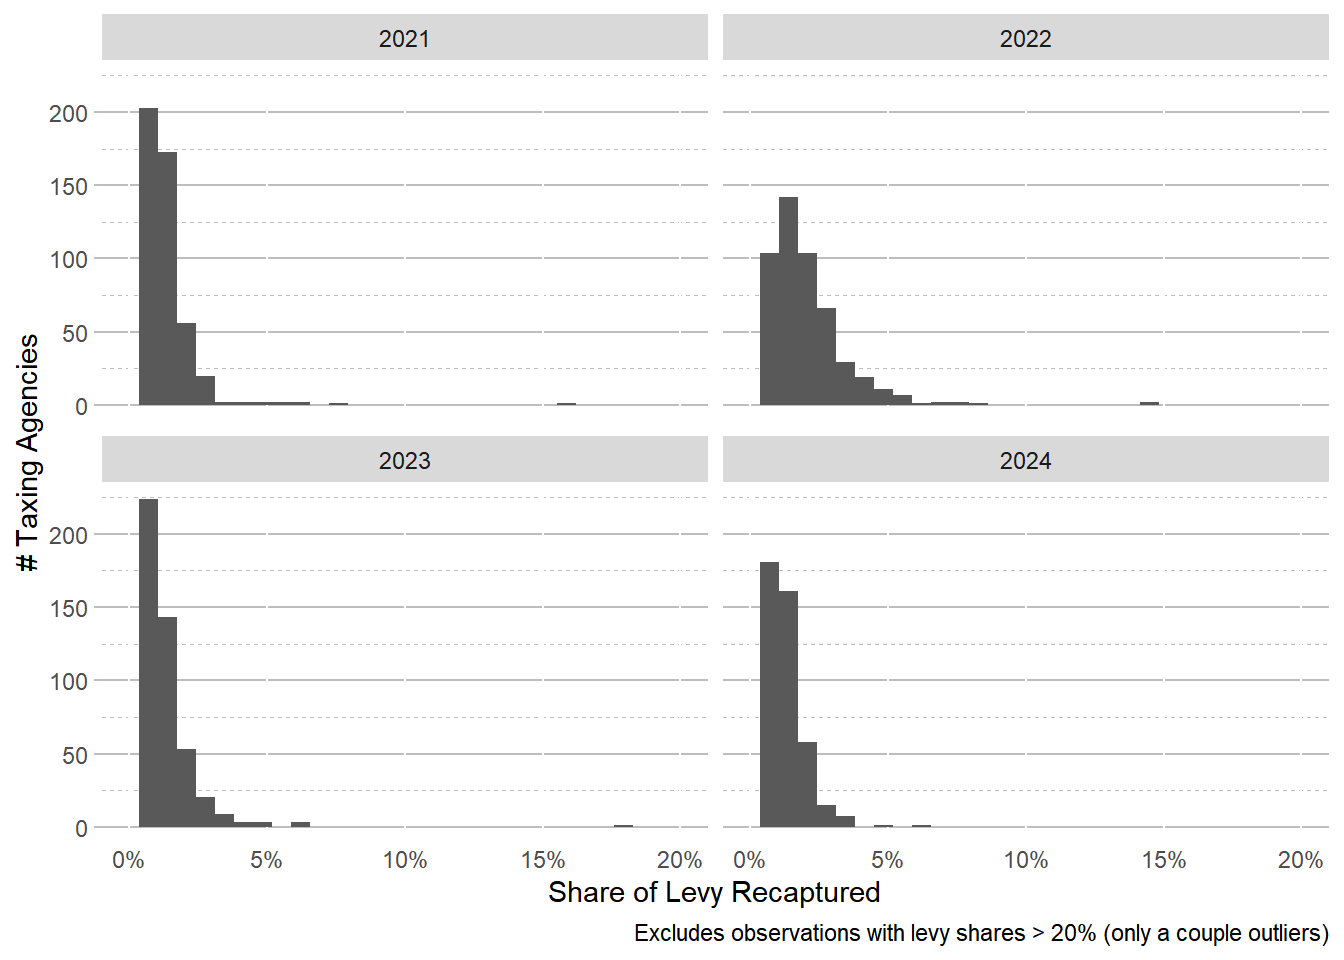
**Figure 1. Share of Levy Recaptured.**
Only non-homerule taxing agencies are eligible to recapture refunds. Share of levy recaptured = recaptured funds / agency levy.
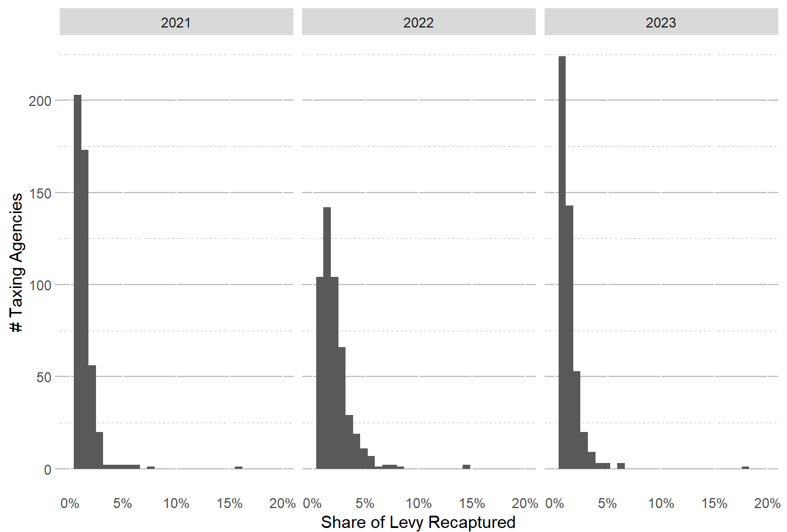
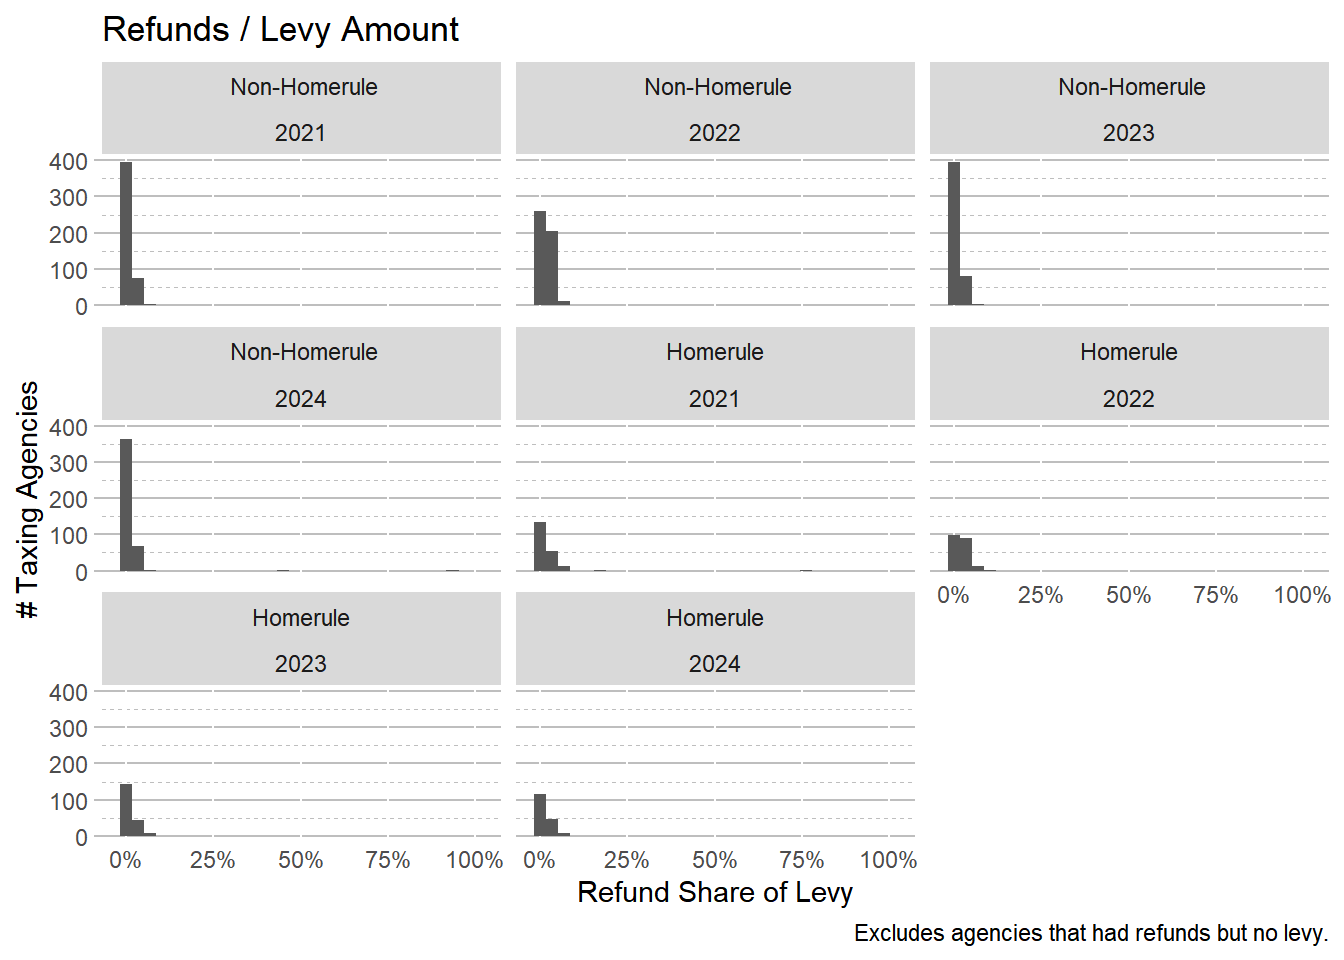
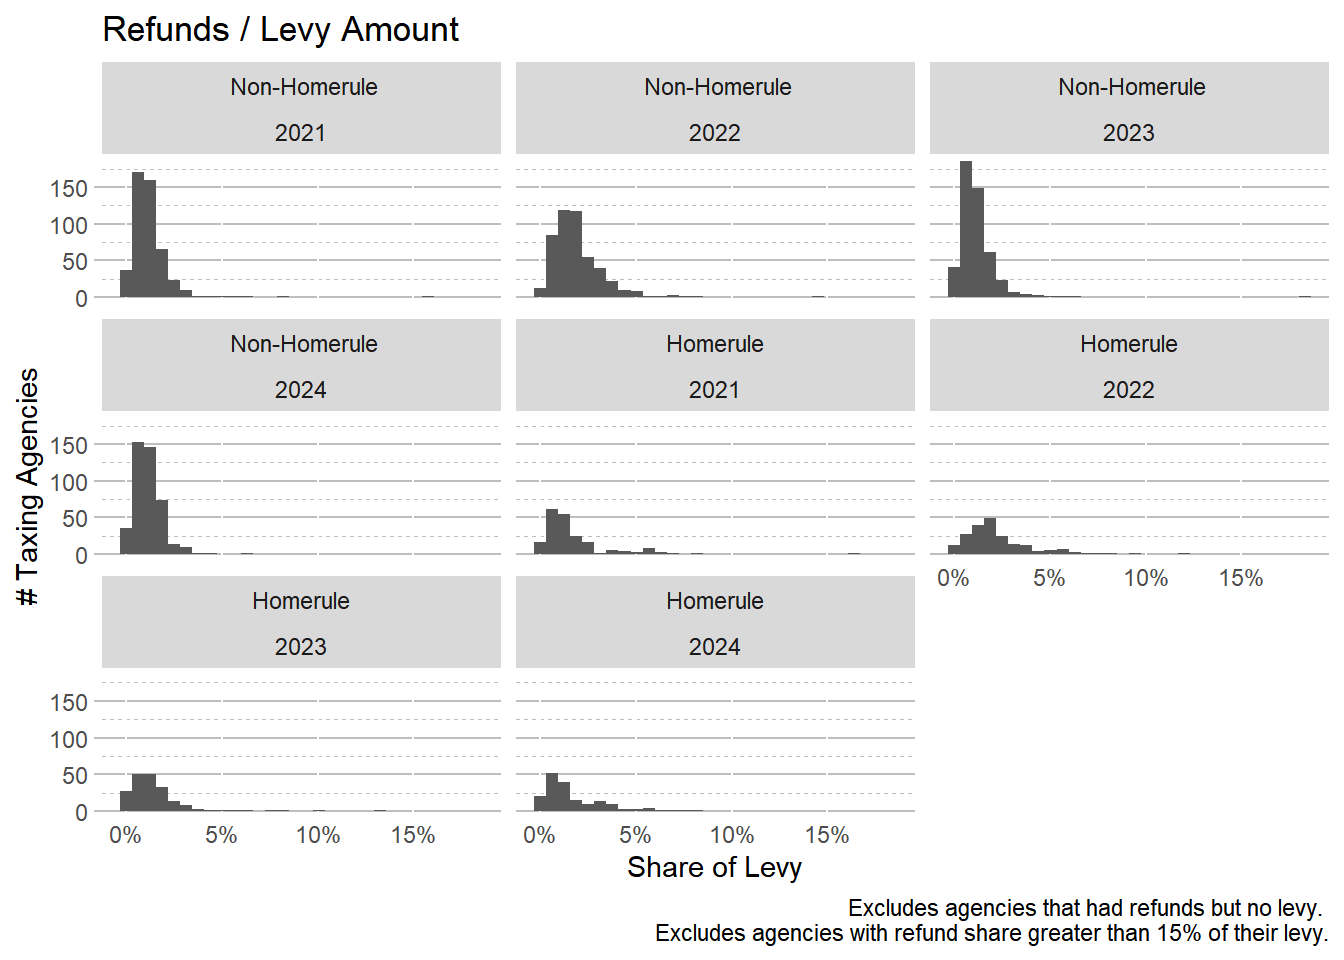
**Figure 2. Refunds as a Percent of Levy.** \
Over 800 taxing agencies had levies and refunds in a given year, but only non-homerule agencies are eligible to recapture refunds. Image excludes agencies with a refund larger than 30% of their levy (n=41) to improve legibility. Taxing agencies that had refunds but did not have a tax levy are excluded from the graph. Share of levy = refunds / levy.
### The Recapture Provision can matter due to overlapping taxing bodies
For most taxpayers, the effect of the Recapture Provision on their property tax bills is negligible. The exception is when multiple overlapping taxing bodies *recapture lost revenues in the same tax bill*, which can cause small increases to add up for individual taxpayers. Ford Heights and Calumet City, for example, saw increases in their composite tax rates of approximately 0.5 percentage points. However, since the composite tax rate is relatively high in those areas, that 0.5 percentage point increase due to recapture was only a 3.6% increase in their tax rates compared to what it would have been without the recapture provision.
### Conclusion
The research team found that the Recapture Provision is widely used but has had a minimal impact on tax rates for several reasons. While some taxing agencies see a large share of their levy recaptured, they only account for a few percentage points of the composite tax rate. Moreover, most taxing districts have relatively small levies and thus recapturing even a handful of refunds could dramatically impact individual agency rates without a concomitant increase in composite tax rates seen by taxpayers.
## Supporting Code
<!--- New variable: authority_num --->
```{r}
nicknames <- readxl::read_xlsx("../Necessary_Files/muni_shortnames.xlsx") |>
mutate(agency_number = str_pad(as.character(agency_number), 9, pad = "0" ) )
#ptaxsim_db_conn <- DBI::dbConnect(RSQLite::SQLite(),
# "../ptaxsim.db/ptaxsim-2023.0.0.db")
ptaxsim_db_conn <- DBI::dbConnect(RSQLite::SQLite(), "./../ptaxsim.db/ptaxsim-2024.0.0.db")
agency_info <- DBI::dbGetQuery(
ptaxsim_db_conn,
"SELECT *
FROM agency
"
) %>%
mutate_if(is.integer64, as.integer) |>
mutate_if(is.integer, as.numeric) |>
# select(- c(cty_dupage_eav:cty_livingston_eav)) |>
mutate(
total_final_levy = ifelse(is.na(total_final_levy), total_ext, total_final_levy),
cty_cook_eav = ifelse(is.na(cty_cook_eav) & total_final_levy > 0, total_final_levy / (total_final_rate/100), cty_cook_eav),
cty_total_eav = ifelse(is.na(cty_total_eav) & total_final_levy > 0 , total_final_levy / (total_final_rate/100), cty_total_eav),
pct_inCook = round(cty_cook_eav / cty_total_eav, digits = 3) )
agency_fund <- DBI::dbGetQuery(
ptaxsim_db_conn,
"SELECT *
FROM agency_fund
"
)
agency_names <- DBI::dbGetQuery(
ptaxsim_db_conn,
"SELECT DISTINCT *
FROM agency_info
"
)
agency_fund_info <- DBI::dbGetQuery(
ptaxsim_db_conn,
"SELECT *
FROM agency_fund_info
"
)
#-- See all agencies that have changed to funds
agency_crosswalk <- dbGetQuery(ptaxsim_db_conn,
"SELECT * FROM agency_crosswalk")
#-- See the same change at the fund level
agency_fund_crosswalk <- dbGetQuery(ptaxsim_db_conn,
"SELECT * FROM agency_fund_crosswalk")
new_agency_fund_info <- dbGetQuery(ptaxsim_db_conn,
"SELECT * FROM agency_fund_info WHERE fund_num NOT LIKE '%000'"
)
```
```{r}
agency_funds <- left_join(agency_fund, agency_fund_info) |> left_join(agency_fund_crosswalk)
agency_funds <- agency_funds %>%
mutate_if(is.integer64, as.integer) |>
mutate_if(is.integer, as.numeric)
agency_funds <- left_join(agency_funds, agency_names) |>
mutate(agency_name = ifelse(agency_num == "070390000", agency_name == "INVERNESS FIRE PROT DIST (FKA PALATINE)", agency_name) ) |>
mutate(agency_name = ifelse(agency_num == "140020000", agency_name == "BRONZEVILLE EXPANDED MENTAL HEALTH SERV DIST", agency_name) )|>
mutate(agency_name = ifelse(agency_num == "020070003", agency_name == "TOWN ELK GROVE ROAD FUND", agency_name) ) |>
mutate(agency_name = ifelse(agency_num == "042220000", agency_name == "GLENBROOK HIGH SCHOOL DISTRICT 225", agency_name)) |>
mutate(agency_name = ifelse(agency_num == "030910000", agency_name == "VILLAGE OF OAK LAWN", agency_name))
agency_funds |> write_csv("agency_funds_2024.csv")
```
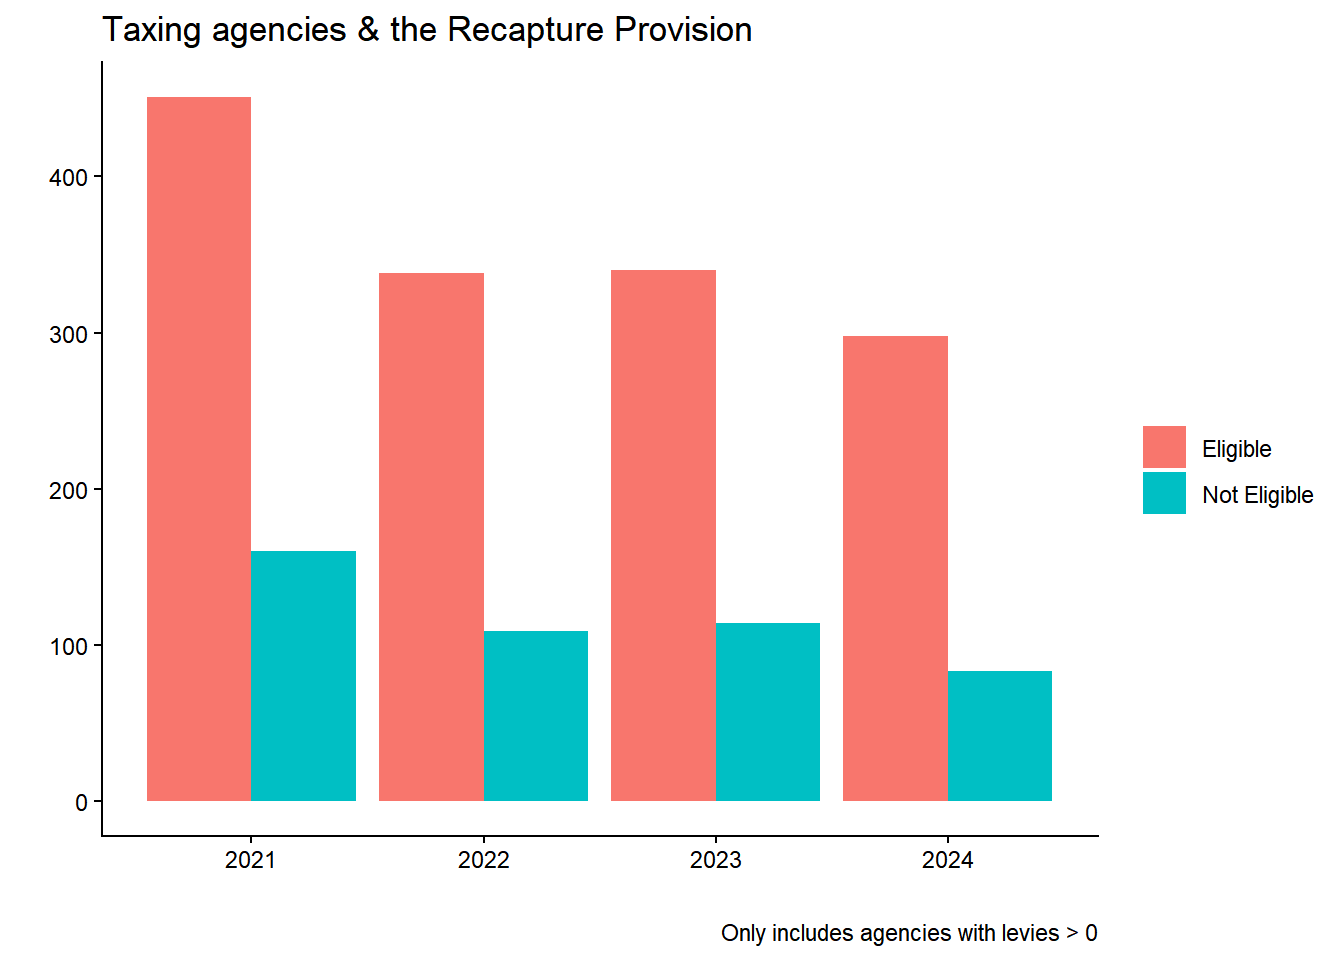
According to PTAXIM agency data, there are 811 agencies with levies in 2021 and 2022, and 816 in 2023.
Of those, 488, 496, and 499 taxing agencies had fund 408 levy amounts greater than \$0 in 2021, 2022, and 2023, respectively.
```{r include=FALSE}
agency_info |> filter(total_final_levy!= 0 & year > 2020) |> group_by(year)|>
summarise(n = n())
agency_funds |>
filter(fund_type_num == 408 &
final_levy != 0 &
year > 2020) |>
group_by(year)|>
summarise(n = n())
```
### PTAXSIM Fund Data: Rate Change from Levy Adjustment
```{r}
#| label: tbl-PTAXSIM-fund408-ratechange
#| tbl-cap: "**Tax rate change due to fund 408.** Data from PTAXSIM database (agency_fund table). Only shows fund 408 associated with the levy recapture fund."
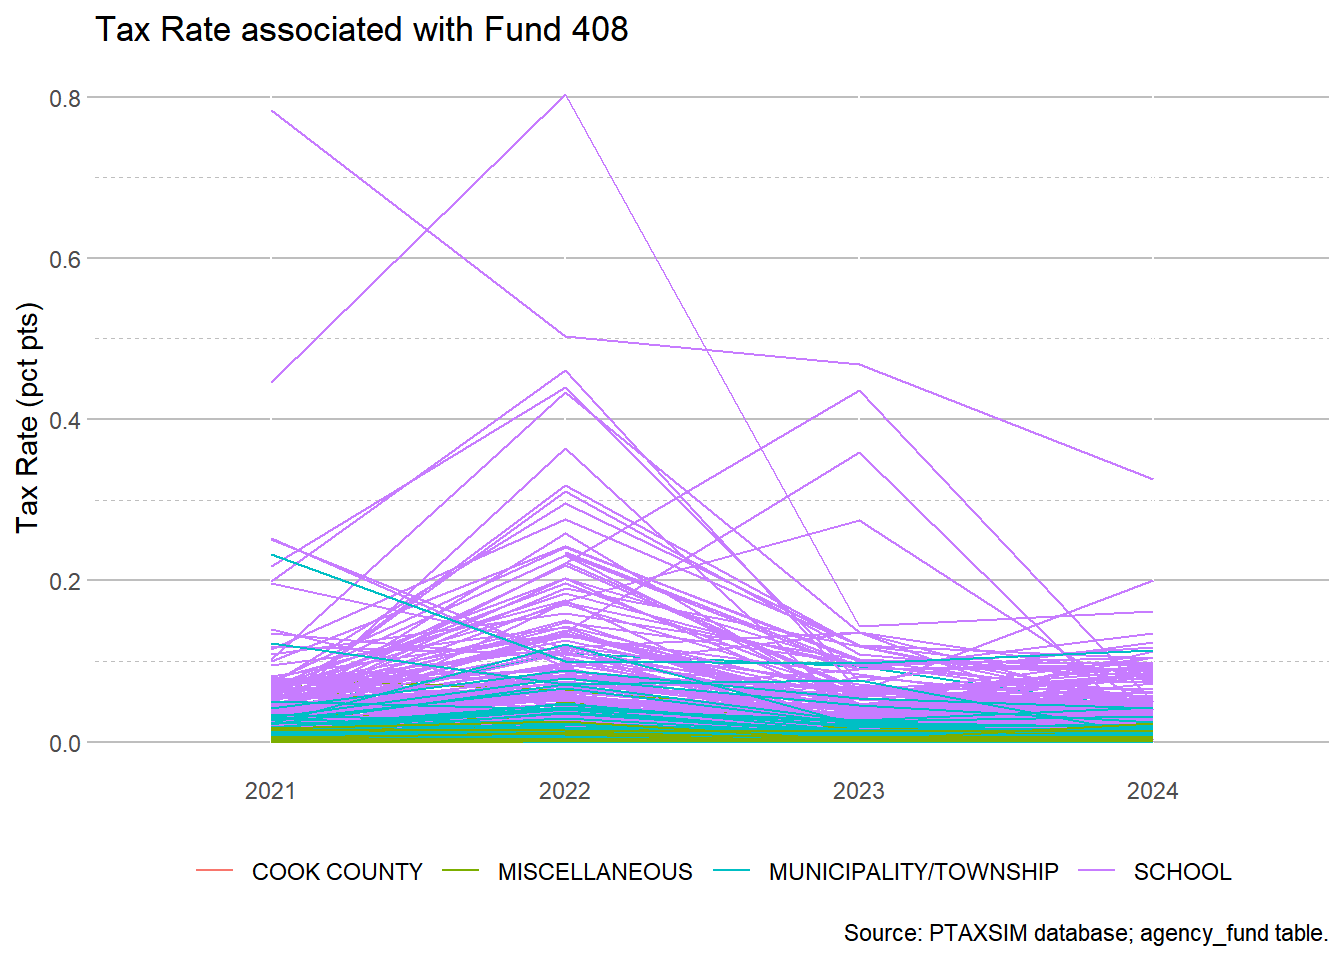
agency_funds |> filter(fund_type_num==408) |>
select(year, agency_name_short, final_levy, final_rate, fund_num) |>
arrange(desc(final_rate)) |> DT::datatable(rownames = FALSE)
```
```{r}
agency_funds |> filter(fund_type_num==408) |>
select(year, agency_name_short, final_levy, final_rate, fund_type_num, major_type) |>
arrange(desc(final_rate)) |>
ggplot() +
geom_line(aes(x=as.character(year), y=final_rate, group=agency_name_short, color = major_type)) +
alea_theme()+
labs(title = "Tax Rate associated with Fund 408",
x = element_blank(), y = "Tax Rate (pct pts)",
color =element_blank(),
caption = "Source: PTAXSIM database; agency_fund table.")
```
```{r}
#| label: tbl-filtered-fund408table
#| tbl-cap: "**MEMO TABLE - Outliers: Largest Agency Level Tax Rate Change due to Fund 408** Data from PTAXSIM database (agency_fund table). 1483 agencies across the three years."
# Calculate the 5th and 95th percentiles
lower_cutoff <- quantile(agency_funds$final_rate[agency_funds$fund_type_num=="408"], 0.05, na.rm=TRUE)
upper_cutoff <- quantile(agency_funds$final_rate[agency_funds$fund_type_num=="408"], 0.95, na.rm=TRUE)
filtered_df <- agency_funds |>
filter(
fund_type_num == 408 &
levy > 0 #&
# capped_ind == 1
) |>
# select(-( loss_pct,levy_plus_loss, rate_ceiling, max_levy, prelim_rate, ptell_reduced_levy, ptell_reduced_ind, fund_num, capped_ind, agency_name_original)) |>
select(year, agency_name, final_rate, final_levy, everything()) |>
filter(final_rate > upper_cutoff)
filtered_df |> DT::datatable(rownames = FALSE)
```
```{r}
#| label: tbl-fund408-deciles
#| tbl-cap: "**95th and 5th percentile cutoff for taxing agencies with fund 408 and levies greater than $0** Data from PTAXSIM database (agency_fund table). Only includes levy amounts for fund 408 associated with the levy recapture fund."
deciles <- agency_funds |>
filter(
fund_type_num == 408 &
levy > 0
) |>
group_by(year) |>
summarize(probs = seq(0.05, 0.95, by = .1),
n = n(),
quantiles = quantile(final_rate, probs = seq(0.05, 0.95, by = 0.1), na.rm = TRUE) )
deciles |> filter(probs == 0.95 | probs == .55)
```
```{r}
#| label: tbl-memo-histogram
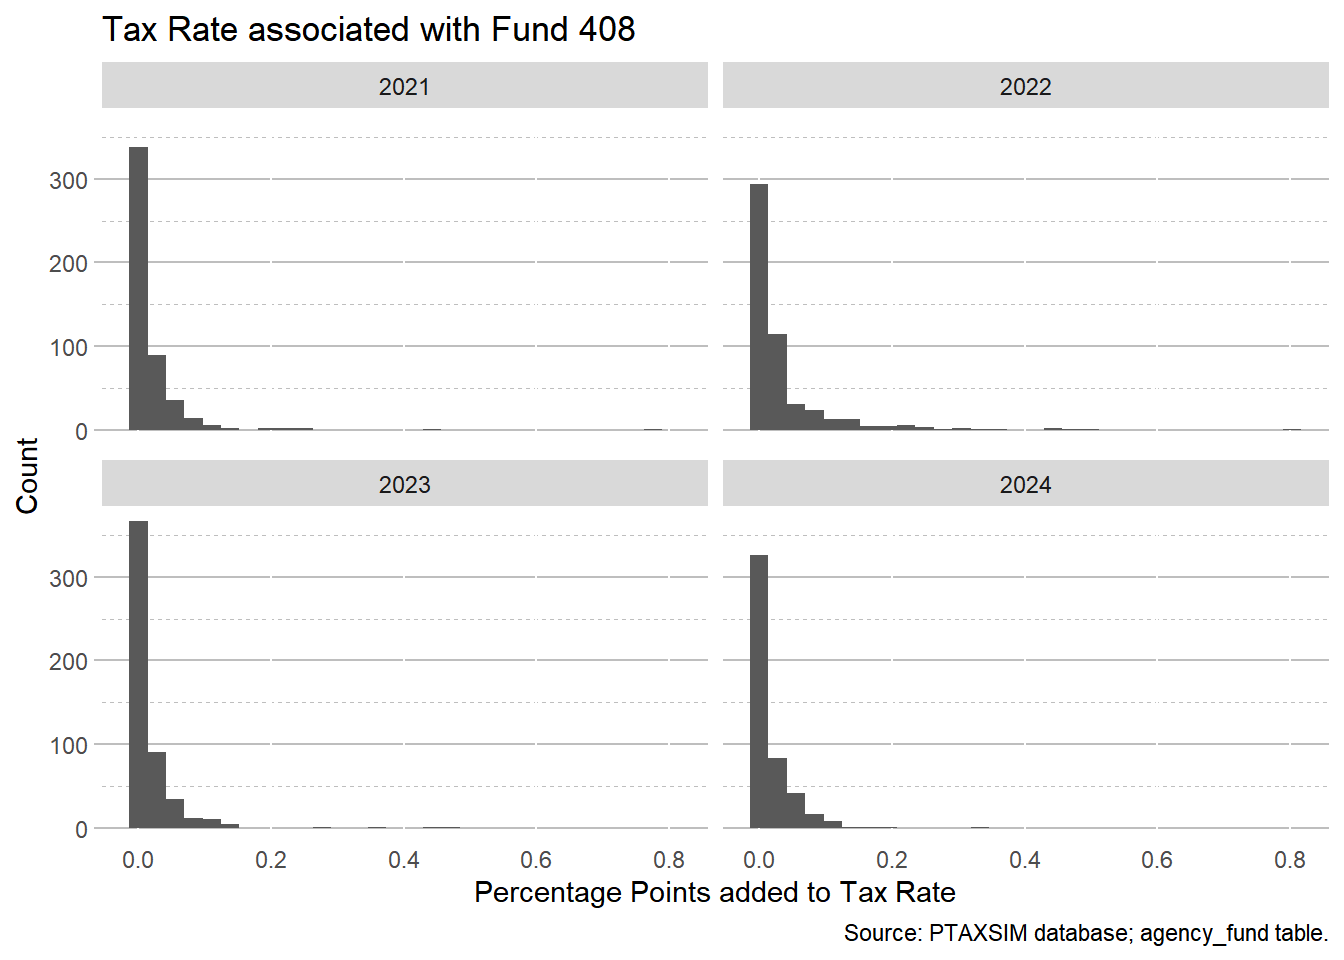
#| tbl-cap: "**Distribution of tax rate increases due to fund 408** (Data Source: PTAXSIM agency_fund table)"
#|
agency_funds |>
filter(fund_type_num==408) |>
ggplot() +
geom_histogram(aes(x=final_rate)) +
alea_theme()+
labs(title = "Tax Rate associated with Fund 408",
caption = "Source: PTAXSIM database; agency_fund table.",
y = "Count", x="Percentage Points added to Tax Rate") +
facet_wrap(~year)
```
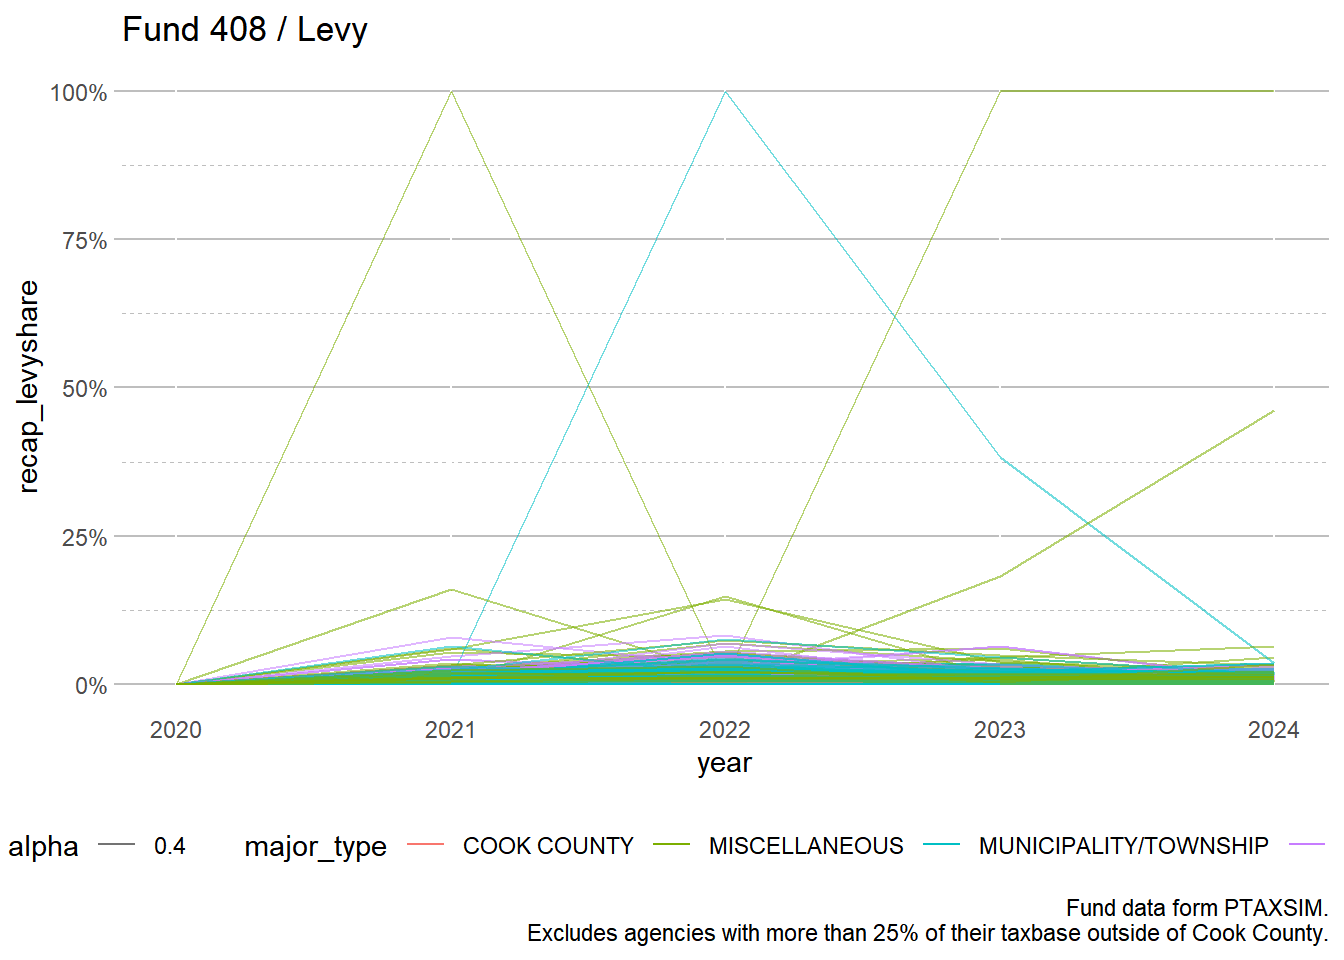
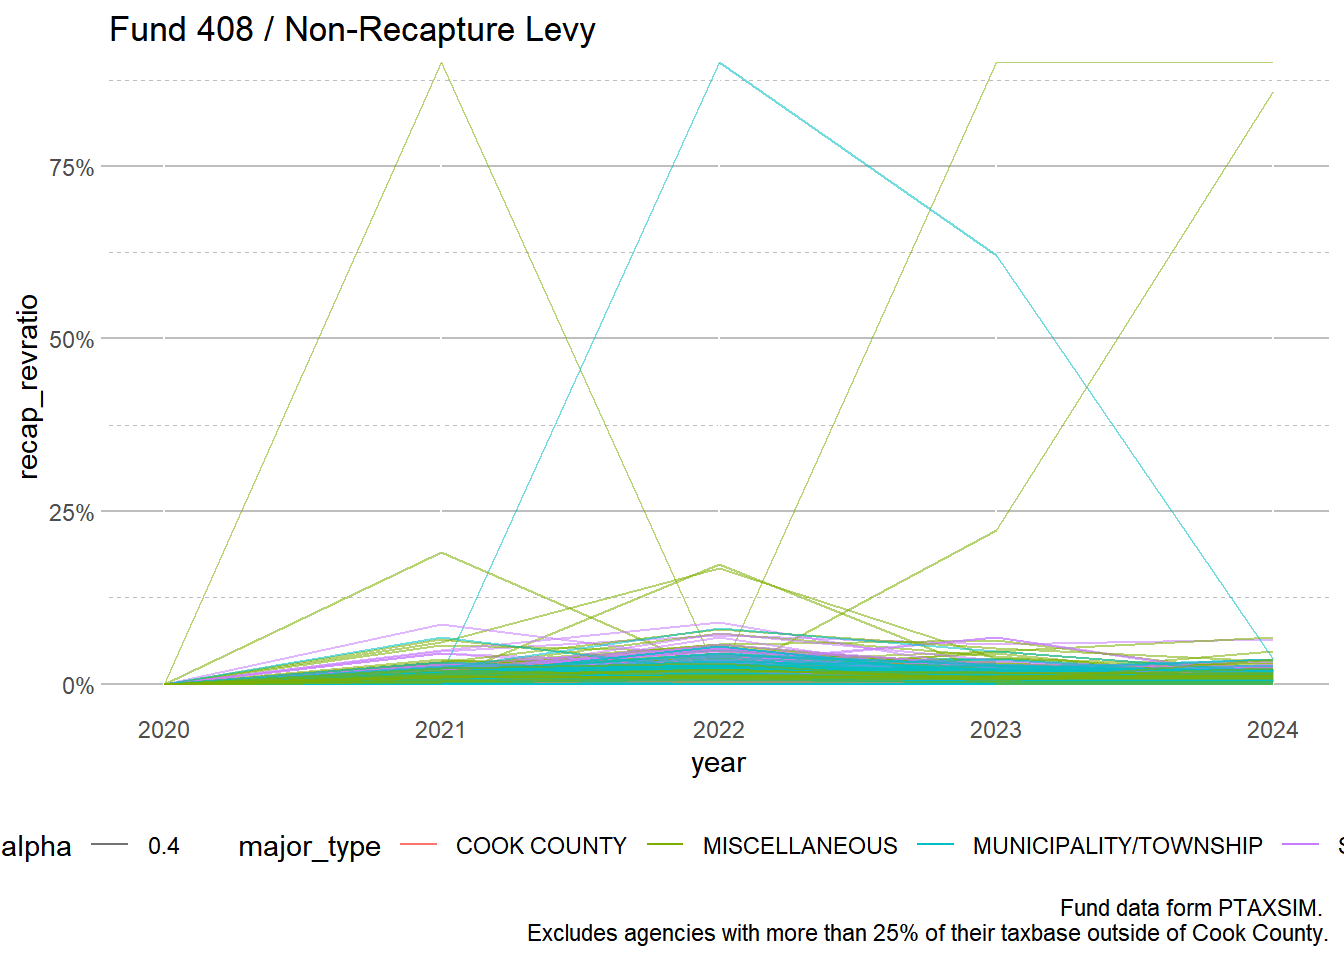
Some agencies have a majority of their taxbase outside of cook county. We will exclude those from this analysis.
```{r fig-ptaxsimfund408}
#| fig-cap: "Data from PTAXSIM database fund level data, and agency level info. Identifies the money amount from fund 408 (recapture) and all other funds that are not 408."
agency_fund408_sums <- agency_funds |>
group_by(year, agency_num, agency_name, major_type, minor_type) |>
mutate(fund408 = ifelse(fund_type_num == 408, final_levy, 0),
not_recap = ifelse(fund_type_num != 408, final_levy, 0) ) |>
summarize(across(c(levy, final_levy, final_rate, fund408, not_recap), sum, na.rm=TRUE))
# after summing to taxing agency level, join the levy back in.
agency_fund408_sums <- left_join(agency_fund408_sums, agency_info, by = c("year", "agency_num")) |>
mutate(total_levy = ifelse(is.na(total_levy), total_final_levy, total_levy ))
agency_fund408_sums |>
filter(year > 2019 & pct_inCook > 0.75) |>
mutate(recap_levyshare = fund408/total_final_levy,
recap_revratio = fund408/not_recap) |>
ggplot() +
geom_line(aes(x=year, y=recap_levyshare, group=agency_name, alpha = .4, color = major_type)) +
alea_theme() +
scale_y_continuous(labels = scales::percent) +
labs(title = "Fund 408 / Levy", caption = "Fund data form PTAXSIM.
Excludes agencies with more than 25% of their taxbase outside of Cook County.")
```
```{r}
agency_fund408_sums |>
filter(year > 2019 & pct_inCook > 0.75) |>
mutate(recap_levyshare = round(fund408/final_levy, digits = 3),
recap_revratio = round(fund408/not_recap, digits = 3)) |>
ggplot() +
geom_line(aes(x=year, y=recap_revratio, group=agency_name, alpha = .4, color = major_type)) +
alea_theme() +
scale_y_continuous(labels = scales::percent) +
labs(title = "Fund 408 / Non-Recapture Levy",
caption = "Fund data form PTAXSIM.
Excludes agencies with more than 25% of their taxbase outside of Cook County.")
```
```{r}
#| label: tbl-datatable-from-ptaxsim
#| tbl-cap: "Values created from PTAXSIM fund table and agency table."
#| include: false
agency_fund408_sums |> DT::datatable(rownames = FALSE)
```
### Comparison to Fund 408 File from Clerk/Treasurer
File name: `Levy Adjustment Fund 408 Extension 2021-2023.xlsx`
> Coding Note: Agency names had double spaces between words in the excel file. They were CTRL-F and replaced with a single space in the excel file.
```{r}
#| label: tbl-fund408-fromtreasurer
#| tbl-cap: "**Data Comparison** Calculates difference in Fund 408 amounts from PTAXSIM and the values from the `Levy Adjustment Fund 408 Extension 2021-2023.xlsx`. Fund 408 data from Treasurer (`FundExtension`) is joined to fund 408 data (`fund408`, `total_final_levy`, `total_ext`) in PTAXSIM database (created by CCAO). Excludes agencies with less than 75% of their EAV in Cook County."
fund408_fromtreas <- readxl::read_xlsx("../PTAB/Levy Adjustment Fund 408 Extension 2021-2023.xlsx", col_types = c("numeric","text", "text", "text","text", "numeric", "text"))
fund408_fromtreas <- fund408_fromtreas |>
rename(year = `Tax Year`,
agency_num = Agency,
agency_name= `Agency Name`,
fund_num = Fund)|>
# mutate(year=as.integer(year)) |>
mutate(agency_name = ifelse(agency_num == "070390000", agency_name == "INVERNESS FIRE PROT DIST (FKA PALATINE)", agency_name) ) |>
mutate(agency_name = ifelse(agency_num == "140020000", agency_name == "BRONZEVILLE EXPANDED MENTAL HEALTH SERV DIST", agency_name) )|>
mutate(agency_name = ifelse(agency_num == "020070003", agency_name == "TOWN ELK GROVE ROAD FUND", agency_name) )|>
mutate(agency_name = ifelse(agency_num == "042220000", agency_name == "GLENBROOK HIGH SCHOOL DISTRICT 225", agency_name))
agency_fund408_sums |>
ungroup() |>
right_join(fund408_fromtreas, by = c("year", "agency_num" )) |>
mutate(agency_name = ifelse(is.na(agency_name.x), agency_name.y, agency_name.x)) |>
select(year, agency_name, fund408, FundExtension,
total_final_levy, total_ext, pct_inCook, agency_num ) |>
mutate(difference = round(fund408-FundExtension, digits = 0), .before = pct_inCook ) |>
mutate(difference = ifelse(is.na(fund408), -FundExtension, difference), .before = pct_inCook ) |>
mutate(across(fund408:difference, round, digits =0)) |>
filter(year>2020 & pct_inCook > 0.75) |>
DT::datatable(rownames = FALSE)
```
> Taxing districts with the largest differences appear seem to generally be border crossers so it might just be a data issue of what is included in ptaxsim vs what is included in the treasurer's files. Agencies with less than 75% EAV in Cook County have been excluded from the table above.
## PTAB Documents from Clerk / Treasurer
### Recapture data from the Levy Adjustment Files
The **Levy Adjustment** Files exist for 4 years. They use the refund amounts from the previous year to calculate how much to add to Fund 408 for the tax year in the file.
These are the files that Merriman wants us to fill in the non-eligible agencies' information.
For example, Levy Adjustment 2021 shows the amount that was refunded in 2020. `ptab_refunds` from these files represent the recaptured funds from eligible agencies (if they did not waive their right to recapture the funds) that they had to give back the previous tax year due to successful PTAB appeals.
All observations' `aggregate_refund` amounts equal their `levy_adjustment` values.
> AWM added the 2025 adjustment file on July 14, 2026, much later than the memo was written.
```{r}
#| label: tbl-levyadjustments
#| tbl-cap: "**Recaptured levy amounts** `adjust_all` has all levy adjustments from the new recapture legislation since 2021. Variables labeled with `refund` represent the amount that was recaptured due to refunds for eligible taxing agencies. Many agencies are Not Eligible due to homerule status."
adjust2021 <- readxl::read_xlsx("../PTAB/Levy Adjustment 2021 for PA 102-0519 CORRECTED.xlsx") |>
mutate(year = 2021) |> # year = Tax Year
select(year,
agency_number = Agency,
agency_name = `Agency Name`,
adjust_eligible = `Adjustment Eligibility`,
lastyear_rate = `2020 Rate`,
lastyear_levy = `2020 Total Tax`,
total_ptab_refunds = `Total SPO/PTAB Refunds\r\nCORRECTED\r\n(Mar 23, 2022)`,
total_coe_refunds = `Total Certificate of Error Refunds\r\nCORRECTED\r\n(Mar 23, 2022)`,
aggregate_refunds = `Aggregate Refunds\r\nCORRECTED\r\n(Mar 23, 2022)`,
levy_adjustment = `2021 Prior Year Levy Adjustment CORRECTED\r\n(Mar 23, 2022)`
)
adjust2022 <- readxl::read_xlsx("../PTAB/Levy Adjustment 2022 for PA 102-0519.xlsx") |>
mutate(year = 2022) |>
select(year,
agency_number = Agency,
agency_name = `Agency Name`,
adjust_eligible = `Adjustment Eligibility`,
lastyear_rate = `2021 Rate`,
lastyear_levy = `2021 Total Tax`,
total_ptab_refunds = `Total SPO/PTAB Refunds`,
total_coe_refunds = `Total Certificate of Error Refunds`,
aggregate_refunds = `Aggregate Refunds`,
levy_adjustment = `2022 Prior Year Levy Adjustment\r\n(Fund 408)`
)
adjust2023 <- readxl::read_xlsx("../PTAB/Levy Adjustment 2023 for PA 102-0519.xlsx") |>
mutate(year = 2023) |>
select(year,
agency_number = Agency,
agency_name = `Agency Name`,
adjust_eligible = `Adjustment Eligibility`,
lastyear_rate = `2022 Rate`,
lastyear_levy = `2022 Total Tax`,
total_ptab_refunds = `Total SPO/PTAB Refunds`,
total_coe_refunds = `Total Certificate of Error Refunds`,
aggregate_refunds = `Aggregate Refunds`,
levy_adjustment = `2023 Prior Year Levy Adjustment\r\n(Fund 408)`
)
adjust2024 <- readxl::read_xlsx("../PTAB/Levy Adjustment 2024 for PA 102-0519.xlsx") |>
mutate(year = 2024) |>
select(year,
agency_number = Agency,
agency_name = `Agency Name`,
adjust_eligible = `Adjustment Eligibility`,
lastyear_rate = `2023 Rate`,
lastyear_levy = `2023 Total Tax`,
total_ptab_refunds = `Total SPO/PTAB Refunds`,
total_coe_refunds = `Total Certificate of Error Refunds`,
aggregate_refunds = `Aggregate Refunds`,
levy_adjustment = `2024 Prior Year Levy Adjustment\r\n(Fund 408)`
)
adjust2025 <- readxl::read_xlsx("../PTAB/levy-adjustment-2025-for-pa-102-0519.xlsx") |>
mutate(year = 2025) |>
select(year,
agency_number = Agency,
agency_name = `Agency Name`,
adjust_eligible = `Adjustment Eligibility`,
lastyear_rate = `2024 Rate`,
lastyear_levy = `2024 Total Tax`,
total_ptab_refunds = `Total SPO/PTAB Refunds`,
total_coe_refunds = `Total Certificate of Error Refunds`,
aggregate_refunds = `Aggregate Refunds`,
levy_adjustment = `2025 Prior Year Levy Adjustment\r\n(Fund 408)`
)
adjust_all <- rbind(adjust2021, adjust2022, adjust2023, adjust2024, adjust2025) |>
mutate(levy_adjustment = as.numeric(levy_adjustment)) |>
left_join(agency_info, by = c("agency_number" = "agency_num", "year")) |>
mutate(recap_levyshare = round(levy_adjustment / total_final_levy, digits = 3) ) |>
mutate(across(.cols=c(lastyear_levy:levy_adjustment), round, digits = 0)) |>
# exclude the rows that had Totals in them (using their missing agency numbers)
filter(!is.na(agency_number)) |>
# recap levyshare is the amount of recapture / previous year's levy.
# Same year levy values are merged in in a seperate data frame.
# fix agency names
mutate(agency_name = ifelse(agency_number == "070390000", agency_name == "INVERNESS FIRE PROT DIST (FKA PALATINE)", agency_name) ) |>
mutate(agency_name = ifelse(agency_number == "140020000", agency_name == "BRONZEVILLE EXPANDED MENTAL HEALTH SERV DIST", agency_name) )|>
mutate(agency_name = ifelse(agency_number == "020070003", agency_name == "TOWN ELK GROVE ROAD FUND", agency_name) )|>
mutate(agency_name = ifelse(agency_number == "042220000", agency_name == "GLENBROOK HIGH SCHOOL DISTRICT 225", agency_name)) |>
mutate(agency_name = ifelse(agency_number == "030910000", agency_name == "VILLAGE OF OAK LAWN", agency_name))
adjust_all |>
select(year, agency_name, agency_number, adjust_eligible, aggregate_refunds, levy_adjustment, everything() )|>
DT::datatable(rownames = FALSE)
```
```{r}
#| include: FALSE
adjust_all |> filter(levy_adjustment == 0 & total_levy > 0 & adjust_eligible == "Eligible" & year < 2024)
```
**24 agencies had levies \> \$0 and were eligible for recapture and had no levy adjustments BUT they also had no refunds. This makes it appear like all agencies eligible for recapture accepted the recaptured funds.**
### Recapture Eligible Descriptive Stats
**"Descriptive Stats for 2024 property tax refunds"**
Four Levy Adjustment Excel Files have the taxing agency, adjustment eligibility, previous year's tax rate and previous year's levy, as well a the amount of refunds from PTAB and COEs.
> These are descriptive stats for non-homerule taxing agencies that are eligible for recapture!
```{r}
adjust_all |>
filter(
adjust_eligible == "Eligible" &
is.finite(recap_levyshare)
) |>
ggplot() +
alea_theme() +
geom_histogram(aes(x=recap_levyshare)) +
scale_x_continuous(limits = c(0, 0.20), label = scales::percent)+
facet_wrap(~year) +
labs(caption = "Excludes observations with levy shares > 20% (only a couple outliers)", x = "Share of Levy Recaptured", y = "# Taxing Agencies")
```
```{r}
#| tbl-cap: "**Alea's Method** Uses aggregate_refunds/total_final_levy to create recap levyshare. Aggregate Refunds is from the clerk & treasurers files with levy adjustment information and the levy amount is from ptaxsim. Excludes agencies that did not have a levy amount (which ends up droping tax year 2024 since there isn't levy values for that year in the ptaxsim database)."
awm_levyshare_byagency <- adjust_all |>
arrange(year, desc(recap_levyshare)) |>
select(year, agency_name, recap_levyshare, everything()) |>
filter(total_final_levy > 0 )
#
# awm_levyshare_byagency |> # n is 2412 agencies
# DT::datatable(rownames = FALSE)
awm_levyshare_byagency |>
filter(pct_inCook > 0.75) |> # n becomes 2,233 agencies
filter(adjust_eligible == "Eligible") |> # n becomes 1,454
DT::datatable(rownames = FALSE)
```
```{r}
#| label: tbl-deciles_AWM
#| tbl-cap: "Recapture's share of Agencies' Levies. Uses AWM's method of joining in ptaxsim levy data that corresponds with the recapture amount's year. Excludes agencies that have less than 75% of their EAV within Cook County."
deciles <- awm_levyshare_byagency |>
filter(pct_inCook > 0.75) |>
filter(adjust_eligible == "Eligible") |>
group_by(year) |>
summarize(probs = seq(0.05, 0.95, by = .1),
n= n(),
quantiles = quantile(recap_levyshare, probs = seq(0.05, 0.95, by = 0.1), na.rm = TRUE) )
deciles |> filter(probs == 0.95 | probs == .55)
```
**In 2022, 95% of actively taxing taxing agencies had RECAPTURED refunds equal to less than 5% of their levy. In 2021 and 2023, 95% of agencies had 3% of their levy be refunded. This is out of the \~480 agencies that were at least 75% within Cook County (based on their EAV), eligible for recapture funds, and had non-zero values for their levies.**
```{r tbl-mtable3}
#| tbl-cap: "Levy Share for Tax Year 2021. Uses levy adjustment / total_final_levy to create recap levyshare. Shows eligible and non-eligible taxing agencies from the levy_adjustment files."
awm_levyshare_byagency |>
filter(year == 2021) |>
filter(pct_inCook > 0.75) |>
DT::datatable(rownames = FALSE)
```
```{r tbl-mtable4}
#| tbl-cap: "Levy Share for Tax Year 2022. Uses levy levy_adjustment / total_final_levy to create recap levyshare"
awm_levyshare_byagency |> filter(year == 2022) |>
filter(pct_inCook > 0.75) |>
DT::datatable(rownames = FALSE)
```
```{r tbl-mtable5}
#| tbl-cap: "Levy Share for Tax Year 2023. Uses levy_adjustment / total_final_levy to create recap levyshare."
awm_levyshare_byagency |> filter(year == 2023)|>
filter(pct_inCook > 0.75) |> DT::datatable(rownames = FALSE)
```
```{r tbl-mtable-2024}
#| tbl-cap: "Levy Share for Tax Year 2024. Uses levy_adjustment / total_final_levy to create recap levyshare. (Added to website post-memo)"
awm_levyshare_byagency |> filter(year == 2024)|>
filter(pct_inCook > 0.75) |> DT::datatable(rownames = FALSE)
```
### Refund data from the Levy Recapture Files (Source: Clerk / Treasurer)
> There are taxing agencies that have refunds and are not active taxing agencies. The agencies themselves are named things like "2013A Bond Escrow Account". Refunds from these accounts are probably not included in recapture funds that are added to the levy since the money was in an escrow fund agency and the taxing agency does not actively tax the public
The **Levy Recapture Files** break up the refunds into 2 categories: PTAB/SP Refunds and CofE (Over-Assessment) Refunds.
Treasurer's office sent the account specific files to the Clerk's office, and the Clerk's office sent them to Drucker and Merriman.
Two of the file have very detailed PTAB&SP and CofE tabs that have very detailed sheets of the amount of refund from previous years' appeals, but not sure how to use that information for now. (2022 and 2023 are missing the detailed sheets)
*Note: the variables are named "recouped" in these files which is potentially confusing* \^However, the variable names do make sense from the Treasurer's point of view, and they made the files in the first place.
```{r}
#| label: tbl-refundsdata
#| tbl-cap: "Files from `PTAB/levy recapture/` including `Levy Recapture vf2 as received from CCTO 2022-03-23.xlsx`, Levy Recapture - 221116.xlsx`, etc. 11,120 observations if agencies without refunds are left in dataset. 6,042 if filtering for agencies that have non-zero refunds."
# year = Tax Year. Date in file name is from agency creation of file or reception of file date.
refund2021 <- readxl::read_xlsx("../PTAB/levy recapture/Levy Recapture - vf2 as received from CCTO 2022-03-23.xlsx")|>
mutate(year = 2021) |>
select(-Total) |>
rename(`Agency Number` = `Agency Number (Text)`,
`CofE (Over-Assessment)` = `CofE Recouped`) |>
mutate(across(where(is.numeric), round, digits =0))
refund2022 <- readxl::read_xlsx("../PTAB/levy recapture/Levy Recapture - 221116.xlsx") |>
mutate(year = 2022)
# refund data for Nov 1 2022 to Oct 31 2023. These refund would be added to the levy for tax year 2023?
refund2023 <- readxl::read_xlsx("../PTAB/levy recapture/Levy Recapture - 231129 orig from TR.xlsx") |>
mutate(year = 2023)
# refund data for Nov 1 2023 through Oct 31 2024. These refunds would be added to the levy for tax year 2024?
refund2024 <- readxl::read_xlsx("../PTAB/levy recapture/Levy Recapture - 241115 orig from TR.xlsx") |>
mutate(year = 2024)
refund_all <- rbind(refund2021, refund2022, refund2023, refund2024) |>
rename(agency_number = `Agency Number`,
agency_name = `Agency Name`,
refunded_sp_ptab = `SP/PTAB Recouped`, # recouped is confusing variable name, so renamed to refunds
refunded_coe = `CofE (Over-Assessment)`) |>
mutate(across(where(is.numeric), round, digits =0)) |>
# keep observations with non-missing variables
filter(!is.na(agency_number)) |>
mutate(total_refunds = refunded_sp_ptab + refunded_coe) |>
# fix agency names
mutate(agency_name = ifelse(agency_number == "070390000", agency_name == "INVERNESS FIRE PROT DIST (FKA PALATINE)", agency_name) ) |>
mutate(agency_name = ifelse(agency_number == "140020000", agency_name == "BRONZEVILLE EXPANDED MENTAL HEALTH SERV DIST", agency_name) )|>
mutate(agency_name = ifelse(agency_number == "020070003", agency_name == "TOWN ELK GROVE ROAD FUND", agency_name) )|>
mutate(agency_name = ifelse(agency_number == "042220000", agency_name == "GLENBROOK HIGH SCHOOL DISTRICT 225", agency_name)) |>
mutate(agency_name = ifelse(agency_number == "030910000", agency_name == "VILLAGE OF OAK LAWN", agency_name))
refund_all <- refund_all |>
left_join(agency_info, by = c("agency_number" = "agency_num", "year")) |>
mutate(refund_levyshare = round(abs(total_refunds) / total_final_levy, digits = 3) ) |>
filter(total_refunds != 0 & !is.na(total_refunds)) |>
filter(pct_inCook > 0.75 # was 6,042 observations without pct_inCook filter.
# 2,066 after pct_inCook filter if NAs are excluded too.
|
is.na(pct_inCook) # 5,906 observations if including NAs
)
refund_all |>
select(year,agency_name, refund_levyshare, everything()) |>
DT::datatable(rownames = FALSE)
```
`adjust_all` saved as `output/adjust_all.csv`
`refunds_all` saved as `output/refunds_all.csv`
```{r include = FALSE, eval=FALSE}
write_csv(adjust_all, "../output/adjust_all.csv")
write_csv(refund_all, "../output/refunds_all.csv")
```
```{r}
refund_all |>
group_by(year) |>
summarize(refunds = sum(total_refunds, na.rm = T),
n = n(),
n_with_levy = sum(ifelse(total_final_levy != 0, 1, 0), na.rm=TRUE))
```
#### Refunds Levy Share
<!---Merriman said he looked at refunds, but he looked at refunds only for agencies eligible for recapture. (Non Homerule Agencies.)--->
```{r}
#| label: tbl-Merriman-refundreplication
#| tbl-cap: "Replicated most recent email and table in Merriman_recapture_memo.docx file. It is NOT actually for refunds, but recaptured refunds. Uses `levy_adjustment` files! "
adjust_all |> mutate(share = levy_adjustment / lastyear_levy) |> filter(year == 2024 & share > 0.027)
```
There are around 680 actively taxing agencies each year in the refund data. 2037 agencies have non-zero levies (for all years together).
There are around 1500 agencies with refunds each year. Most are Escrow accounts!
There are 678, 680, and 679 agencies with levies that also had refunds in 2021, 2022, and 2023, respectively.
> The drop in agencies with refunds in 2024 may be due to the use of an `authority_num` used by the Clerk. Some taxing agencies were consolidated into an "authority"
```{r}
refund_all |> filter( total_final_levy!=0 & total_refunds != 0) |>
group_by(year) |> summarize(n = n())
```
```{r fig-table6-histogram}
#| fig-cap: "Histograms of total_refunds / levy from the refund_all dataframe."
#| fig-column: margin
# around 1500 agencies with refunds each year. Most are Escrow accounts!
# refund_all |> filter( total_refunds!=0) |> group_by(year) |> summarize(n = n())
# refund_all |> filter( total_final_levy!=0) |> # 2037 agencies have non-zero levies
# group_by(year) |> summarize(n = n()) # around 680 actively taxing agencies each year
refund_all |>
filter( total_final_levy!=0 & total_refunds != 0) |>
mutate(share = round(abs(total_refunds)/total_final_levy, digits = 3),
year = as.character(year),
homerule_label = case_when(
home_rule_ind == "1" ~ "Homerule",
home_rule_ind == "0" ~ " Non-Homerule",
TRUE ~ NA)) |>
filter(!is.na(home_rule_ind) & is.finite(share)) |>
ggplot() +
geom_histogram(aes(x=share)) +
alea_theme() +
labs(title = "Refunds / Levy Amount",
caption = "Excludes agencies that had refunds but no levy.",
x = "Refund Share of Levy",
y = "# Taxing Agencies") +
scale_x_continuous(label = scales::percent)+
facet_wrap(vars(homerule_label, year))
```
```{r}
#| label: tbl-outlierobservations
#| tbl-cap: "Observations with refund amounts that are larger than 5% of its levy. "
refund_outliers <- refund_all |>
filter( (total_final_levy!=0 & !is.na(total_final_levy)) & total_refunds != 0) |>
mutate(share = round(abs(total_refunds)/total_final_levy, digits = 3),
year = as.character(year),
homerule_label = case_when(
home_rule_ind == "1" ~ "Homerule",
home_rule_ind == "0" ~ " Non-Homerule",
TRUE ~ NA
)) |>
filter(share > 0.05) |>
select(year, agency_name, total_refunds, total_final_levy, total_final_rate, refund_levyshare, homerule_label)
#write_csv(refund_outliers, "./output/refund_outliers.csv")
refund_outliers |> DT::datatable(rownames = FALSE)
```
```{r}
#| label: fig-table6-histogramv2
#| fig-cap: "Histograms of total_refunds / levy from the refund_all dataframe. Excludes 41 observations with shares larger than 30% to increase legibility. 2170 agencies have levies and refunds across the three years of data."
refund_all |>
filter( (total_final_levy==0 | is.na(total_final_levy)) & total_refunds != 0) |> arrange(total_refunds)
refund_all |>
filter( total_final_levy!=0 & total_refunds != 0) |>
mutate(share = round(abs(total_refunds)/total_final_levy, digits = 3),
year = as.character(year),
homerule_label = case_when(
home_rule_ind == "1" ~ "Homerule",
home_rule_ind == "0" ~ " Non-Homerule",
TRUE ~ NA
)) |>
# filter(!is.na(home_rule_ind) & is.finite(share) ) |>
filter(share < 0.3) |>
ggplot() +
geom_histogram(aes(x=share)) +
alea_theme() +
labs(title = "Refunds / Levy Amount",
caption = "Excludes agencies that had refunds but no levy.
Excludes agencies with refund share greater than 15% of their levy.",
color = "Home Rule", y = "# Taxing Agencies",
x = "Share of Levy") +
scale_x_continuous(label = scales::percent)+
facet_wrap(vars(homerule_label, year ))
```
```{r}
#| label: tbl-outliers
#| tbl-cap: "Taxing Agencies that had refunds greater than 30% of their levies."
refund_all |>
mutate(share = round(abs(total_refunds)/total_final_levy, digits =4),
year = as.character(year)) |>
filter(share > 0.3) |>
select(agency_name, share, home_rule_ind, year) |>
arrange(desc(share)) |>
DT::datatable(rownames = FALSE)
# 41 observations excluded by filtering below
```
```{r fig-table6b}
#| fig-cap: "Uses total_refunds / levy from the refund_all dataframe. Excludes ratios above 0.25."
#| fig-column: margin
refund_all |>
mutate(share = round(abs(total_refunds)/total_final_levy, digits = 3),
share = ifelse(share>1, 1,share),
year = as.character(year)) |>
filter(year !="2024" & share < 0.25) |> # no values
ggplot() +
# geom_jitter(aes(x=year, y = share, color = as.character(home_rule_ind))) +
geom_point(aes(x=year, y = share, color = as.character(home_rule_ind))) +
# geom_text_repel(data = . %>% filter(share < 0.2),
#aes(x=year, y = share, label = agency_name), nudge_y =.05 ) +
alea_theme() +
scale_y_continuous(limits = c(0, 0.25),
breaks = c(0, .1, .25), label = scales::percent) +
labs(title = "Refunds / Levy Amount",
color = "Home Rule", x=element_blank(),
y = "Share of Levy")
```
```{r tbl-taxingagencies-withlevies}
#| tbl-cap: "Over 8000 observations exist for the 3 years of data, but only 5,906 had refunds. Of those, only 2,390 are actively taxing properties (i.e. have a levy > $0). 2,037 of the agencies with a levy also have refunds. This includes homerule and non-homerule agencies! It is not just recaptured refunds, but **all** refunds. Uses total_refunds/total_final_levy to create refund levyshare. Total Refunds is from the clerk & treasurers files with refund information and the levy amount is from ptaxsim. 2021-2024 refund values. Excludes agencies that did not have a levy amount (which ends up droping tax year 2024 since there isn’t levy values for that year in the ptaxsim database)."
refund_all |>
mutate(refund_share = round(abs(total_refunds)/total_final_levy, digits = 3),
year = as.character(year)) |>
filter(total_final_levy > 0
|
total_refunds != 0
) |>
select(agency_name, refund_share, year, total_refunds, total_final_levy) |>
DT::datatable(rownames = FALSE)
```
## Combine data sources
```{r checkmissing, eval=FALSE, include=FALSE}
# Check for na's
refund_all |>
count(is.na(agency_number)) #0
adjust_all |>
count(is.na(agency_number)) #0
# Check for duplicates
refund_all |>
group_by(agency_number) |>
summarize(n = n()) |>
arrange(desc(n)) |>
filter(n != 4) # 450 agencies did not exist all 4 years in the refund data
adjust_all |>
group_by(agency_number) |>
summarize(n = n()) |>
arrange(desc(n)) |>
filter(n != 4) # 70 agencies did not exist all 4 years in the recapture data
```
```{r include = FALSE}
# Let's do some preliminary clean up work.
rm(adjust2021, adjust2022, adjust2023, adjust2024,
refund2021,refund2022, refund2023, refund2024)
```
### Join data
`Refund_all` had `r paste(count(refund_all))` observations and `adjust_all` had `r paste(count(adjust_all))` observations.
```{r}
#| label: tbl-joineddata
#| tbl-caption: "Joined data from the recapture files and levy_adjustment files from the Clerk and Treasurer. Remember, the names of the files are misleading. Levy_adjustment files include the recapture data."
adjust_recap_all <- full_join(
refund_all, adjust_all,
)
dropped <- adjust_recap_all |>
filter(
(is.na(adjust_eligible) & (is.na(total_refunds) | total_refunds==0 ))
)
adjust_recap_all <- adjust_recap_all |>
# Variables from the "Levy Adjustment" file reference recaptured refunds
# adjustment files do not have refund information for non-eligible agencies.
rename(
total_refund = total_refunds) |>
anti_join(dropped)
adjust_recap_all <- adjust_recap_all |>
select(year, agency_name, home_rule_ind,
refund_levyshare, recap_levyshare,
total_refund, # refund data, all agencies with refunds
aggregate_refunds, # from levy adjustment file
levy_adjustment, total_final_levy, adjust_eligible, pct_inCook,
total_ptab_refunds, # from levy adjustment file, only Eligible agencies with refunds
refunded_sp_ptab, # refund data, all agencies with refunds
total_coe_refunds, # from levy adjustment file
refunded_coe, # refund data, all agencies with refunds
everything())
adjust_recap_all |> DT::datatable(rownames = FALSE)
```
### Final Data Assembly
At this point, we have the data for all Eligible taxing agencies, but missing values for Agencies that are not eligible for levy adjustments (from Fund 408).
We want to get the values for all agencies.
```{r}
#| label: tbl-finaldatable
#| tbl-cap: "Final data table."
# agency_fund408_sums has all levies for all years, but fund 408 only began being used in 2021. Filter to just 2021-2023 for now before joining to the adjust_recap_all data object
final_df <- left_join(adjust_recap_all, agency_fund408_sums|>
filter(year>2020) #,
#by = c("agency_number" = "agency_num", "year")
) |>
mutate(
adjust_eligible = ifelse(home_rule_ind == 1 & is.na(adjust_eligible),
"Not Eligible",
ifelse(home_rule_ind == 0 & is.na(adjust_eligible),
"Eligible", adjust_eligible)
) )
final_df |> DT::datatable(rownames = FALSE)
```
```{r}
#| label: tbl-differences-invariables
#| tbl-cap: "Difference between PTAXSIM's fund 408 values and the Clerk's variable for the levy adjustment."
final_df |>
filter(year > 2020) |> # since ptaxsim database doesn't have fund 408 values for that tax year yet.
# difference between ptaxsim fund 408 recaptured levy amounts and levy adjustment/recaptured amounts from excel files received from Clerk's/treasurer's office
mutate(
fund408 = ifelse(is.na(fund408), 0, fund408),
diff = abs(fund408 - levy_adjustment), # difference between ptaxsim recapture data and levy adjustment files recapture data
) |>
arrange(#desc(diff),
agency_name ) |>
select(year, agency_name, diff, fund408, levy_adjustment, total_refund ) |>
DT::datatable(rownames = FALSE)
```
Joined data saved as `levy_refunds_recoupments_by_agency_2021-2024.csv`
```{r}
#| eval: false
#| include: false
write_csv(final_df |>
filter(between(year, 2021, 2023)),
"../Output/levy_refunds_recoupments_by_agency_2021-2023.csv")
write_csv(final_df, "../Output/levy_refunds_recoupments_by_agency_2021-2024.csv")
```
```{r}
#| label: tbl-joined_dataset_outlierobservations
#| tbl-cap: "Observations with recapture amount that is larger than 5% of its levy. "
refund_outliers <- final_df |>
filter( (total_final_levy!=0 & !is.na(total_final_levy)) & total_refund != 0) |>
mutate(share = round(abs(total_refund)/total_final_levy, digits = 3),
year = as.character(year),
homerule_label = case_when(
home_rule_ind == "1" ~ "Homerule",
home_rule_ind == "0" ~ " Non-Homerule",
TRUE ~ NA
)) |>
filter(share > 0.05) |>
select(year, agency_name, total_refund, total_final_levy, total_final_rate, refund_levyshare, homerule_label, recaptured_funds = aggregate_refunds)
refund_outliers |> DT::datatable(rownames = FALSE)
```
## Data Exploration
### Aggregation to some Composite increase?
```{r}
#| label: aggregatingup
taxcodes <- DBI::dbGetQuery(
ptaxsim_db_conn,
"SELECT *
FROM tax_code
"
)
## Link municipality name to tax code
muni_names <- taxcodes |>
left_join(agency_names) |>
filter(minor_type == "MUNI" | agency_name == "TOWN CICERO") |>
select(tax_code_num, agency_name, agency_name_short) |>
distinct()
impacted_taxcodes <- taxcodes |>
select(-agency_rate) |>
left_join(agency_funds, by = c("year", "agency_num") ) |>
select(year, agency_num, fund_num, levy, final_levy, final_rate, tax_code_num, tax_code_rate) |>
#filter(final_levy > 0) |>
left_join(muni_names, by = "tax_code_num") |>
group_by(year, tax_code_num, tax_code_rate) |>
summarize(
muni_name = first(agency_name),
rate_408 = sum(ifelse(fund_num==408, final_rate, 0), na.rm=TRUE),
rate_non408 = sum(ifelse(fund_num!=408, final_rate, 0), na.rm=TRUE)
) |>
mutate(rate_ratio = round(rate_408 / rate_non408, digits =3)) |>
arrange(desc(rate_ratio))
```
```{r}
#| label: tbl-taxcode-aggregation2023
#| tbl-cap: "Aggregating up to Tax Code Level: 2023"
# impacted_taxcodes |> filter(year == 2022) |> DT::datatable(rownames = FALSE)
# impacted_taxcodes |> filter(year == 2022) |> DT::datatable(rownames = FALSE)
impacted_taxcodes |> filter(year == 2023) |> DT::datatable(rownames = FALSE)
```
```{r}
impacted_munis <- taxcodes |>
select(-agency_rate) |>
left_join(agency_funds, by = c("year", "agency_num") ) |>
select(year, agency_num, fund_num, levy, final_levy, final_rate, tax_code_num, tax_code_rate) |>
left_join(muni_names, by = "tax_code_num") |>
group_by(year, tax_code_num, tax_code_rate) |>
summarize(
muni_name = first(agency_name),
rate_408 = sum(ifelse(fund_num==408, final_rate, 0), na.rm=TRUE),
rate_non408 = sum(ifelse(fund_num!=408, final_rate, 0), na.rm=TRUE)
) |>
group_by(year, muni_name) |>
summarize(
rate_408 = round(mean(rate_408, na.rm=TRUE), digits = 3),
rate_non408 = round(mean(rate_non408, na.rm=TRUE), digits = 3)
) |>
mutate(rate_ratio = round(rate_408 / rate_non408, digits =3)) |>
arrange(desc(rate_ratio)) |>
filter(year > 2020)
impacted_munis |> DT::datatable(rownames = FALSE)
```
```{r}
impacted_munis |> filter(rate_408 > .5) |> DT::datatable(rownames = FALSE)
```
### Descriptive Statistics: Eligible vs. Ineligible
```{r include = FALSE}
rm(agency_info, agency_fund_info, agency_fund, agency_names)
```
```{r}
final_df |>
group_by(year, adjust_eligible) |>
filter(final_levy>0) |>
reframe(n = n()) |>
ggplot(aes(x = year, y = n, fill = adjust_eligible)) +
geom_col(position = "dodge") +
theme_classic() +
labs(title = "Taxing agencies & the Recapture Provision", x="", y = "", fill = "",
caption = "Only includes agencies with levies > 0")
```
```{r}
#| layout-ncol: 3
final_df |>
filter(final_levy>0) |>
mutate(year = as.integer(year)) |>
group_by(year, adjust_eligible) |>
reframe(sum_levy = sum(levy, na.rm=TRUE)) |>
ggplot(aes(x = year, y = sum_levy, color = adjust_eligible)) +
geom_line() +
theme_classic()
final_df |>
filter(between(year, 2021, 2023)) |>
filter(final_levy>0) |>
mutate(year = as.integer(year)) |>
group_by(year, adjust_eligible) |>
reframe(sum_levy = sum(levy, na.rm = T), n = n()) |>
ggplot(aes(x = year, y = sum_levy/n, color = adjust_eligible)) +
geom_line() +
theme_classic() +
labs(title = "Average (Mean) Levy")
final_df |>
filter(final_levy>0) |>
mutate(year = as.integer(year)) |>
group_by(year, adjust_eligible) |>
reframe(sum_refund = sum(abs(total_refund), na.rm = T), n = n()) |>
ggplot(aes(x = year, y = sum_refund, color = adjust_eligible)) +
geom_line() +
theme_classic() +
labs(title = "Refunds by Eligibility")
final_df |>
filter(final_levy>0) |>
group_by(year, adjust_eligible) |>
summarize(perc_levy_ref = sum(abs(total_refund), na.rm = T)/sum(levy, na.rm = T)) |>
ggplot(aes(x = year, y = perc_levy_ref, color = adjust_eligible)) +
geom_line() +
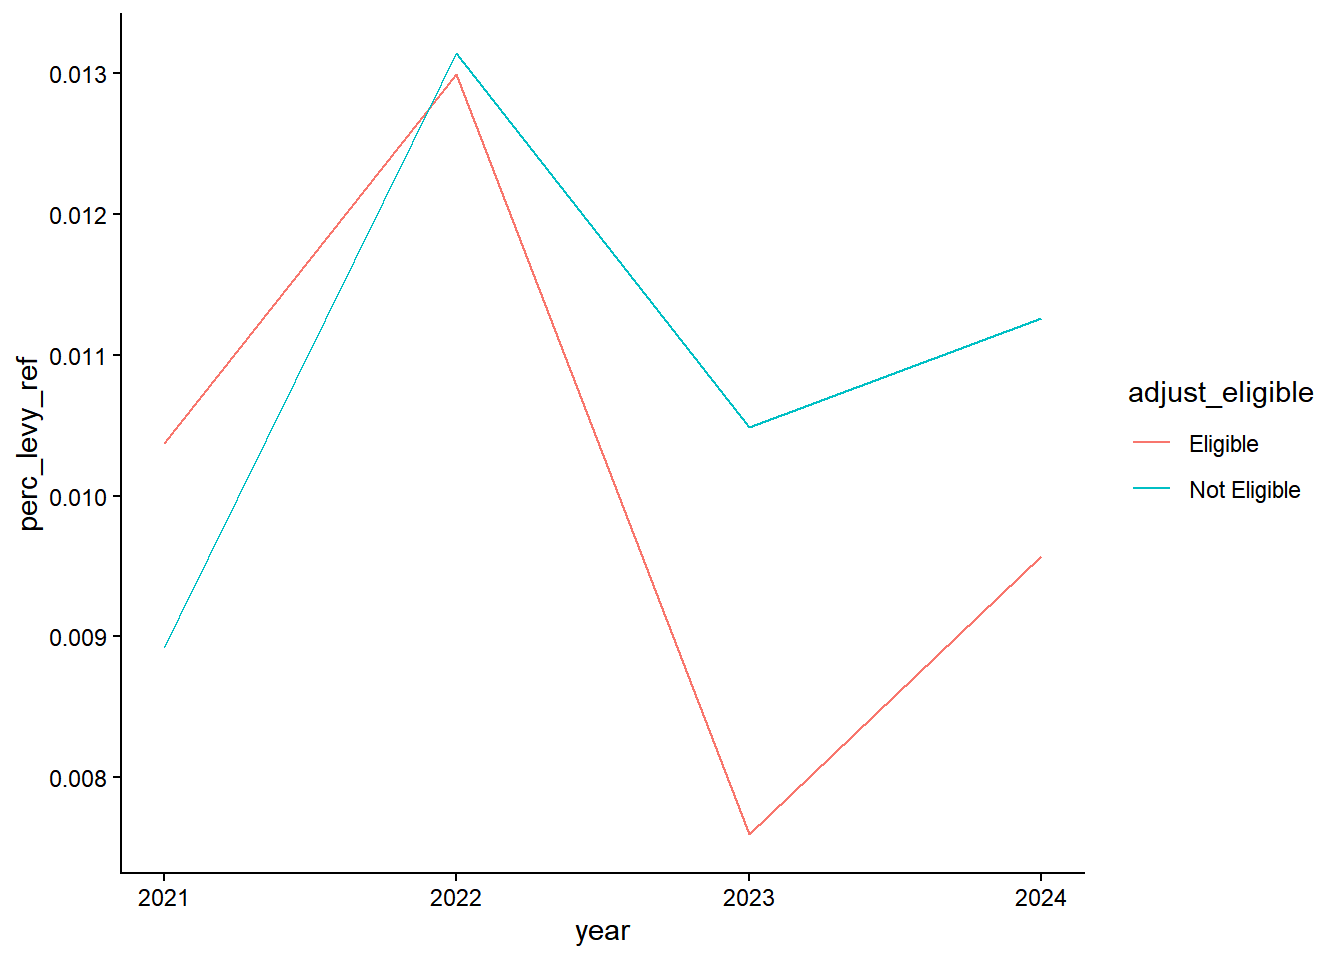
theme_classic()
```
### Who is Eligible but Not Recouping Their Full Amount?
> Barrington and Matteson became homerule by vote in Nov. 2022. They were not eligible for recapture funds as of the 2022 levy. Can be seen in the agency_info table within ptaxsim and in Notes column of 2022 Adjustment excel file.
Some differences in tables below:
- School District 145: Arbor Park School District, had refunds and levies, but FundExtension from treasurer says \$0 for fund 408.
- [Palatine SD 211](https://go.boarddocs.com/il/thsd211/Board.nsf/files/CLXT6W75E666/$file/Adoption%20of%20the%202022%20Tax%20Levy%20(12-15-22).pdf): submitted motion to abate recapture amount. That is not seen in the adjust_all file. So it either got voted down OR the adjustment files do not reflect those that submitted abatements.
- Palatine SD 211 had \$0 recapture when using fund408 == 0, but Palatine SD had a levy_adjustment value that was not \$0.\
- Does that mean that ptaxsim reflects the abatements? or just a data difference by mistake?\
- Had FundExtension = \$0 too (variable from fund 408 extensions from treasurers office)
```{r}
#| label: tbl-eligible
#| tbl-cap: "Agencies that are eligible for recapture and did not have recapture funds."
#| layout-ncol: 2
eligible <- final_df |> filter(adjust_eligible == "Eligible" #& levy > 0
) |>
mutate(
fund408 = ifelse(is.na(fund408), 0, fund408),
diff = abs(fund408 - levy_adjustment)
)
# eligible agencies without fund408 values from ptaxsim
check1 <- eligible |>
filter(fund408==0 & year != 2024) |> distinct(agency_name, year)
check1 |>
pivot_wider(names_from = "year", values_from = "year") |> DT::datatable(rownames = FALSE)
# eligible agencies that had no levy adjustment from the adjustment files
# aka Recapture amount = $0
check2 <- eligible |>
filter(levy_adjustment==0) |> distinct(agency_name, year)
check2 |>
pivot_wider(names_from = "year", values_from = "year") |> DT::datatable(rownames = FALSE)
```
```{r}
#| label: tbl-eligible-cont
#| tbl-cap: "Agencies that are eligible for recapture and did not have recapture funds."
#| layout-ncol: 2
# Eligible agencies from Fund 408 file from Clerk/Treasurer with $0 Extensions
check3 <- eligible |>
full_join(fund408_fromtreas) |>
filter(FundExtension==0) |>
distinct(agency_name, year)
check3 |> pivot_wider(names_from = "year", values_from = "year") |> DT::datatable(rownames = FALSE)
anti_join(check1, check2) |>
pivot_wider(names_from = "year", values_from = "year")
```
```{r}
#| label: tbl-noteligible
#| tbl-cap: "There are no agencies that have refund values that are not eligible for recapture. So that is good."
not_eligible <- final_df |> filter(adjust_eligible == "Not Eligible") |>
mutate(
fund408 = ifelse(is.na(fund408), 0, fund408),
diff = abs(fund408 - levy_adjustment)
)
#non eligible agencies should not have adjustment values or fund408 values
not_eligible |> filter(levy_adjustment!=0 | fund408!=0) |> DT::datatable(rownames = FALSE)
```
```{r}
final_df |> filter(levy_adjustment == 0 & total_levy > 0 & adjust_eligible == "Eligible")
```
### Refunds and Recapture by Minor Class
```{r}
final_df |>
filter(year == 2021 & final_levy > 0 ) |>
group_by(minor_type, adjust_eligible) |>
summarize(n = n()) |>
arrange(desc(n)) |>
pivot_wider(names_from = adjust_eligible, values_from = n)
```
```{r}
final_df |>
filter(minor_type %in% c("PARK", "LIBRARY", "ELEMENTARY") &
final_levy>0) |>
group_by(year, minor_type, adjust_eligible ) |>
summarize(n = n()) |>
ggplot() +
geom_col(aes(x = year, y = n,, fill = minor_type), position = "dodge") +
theme_classic() +
facet_wrap(~adjust_eligible) +
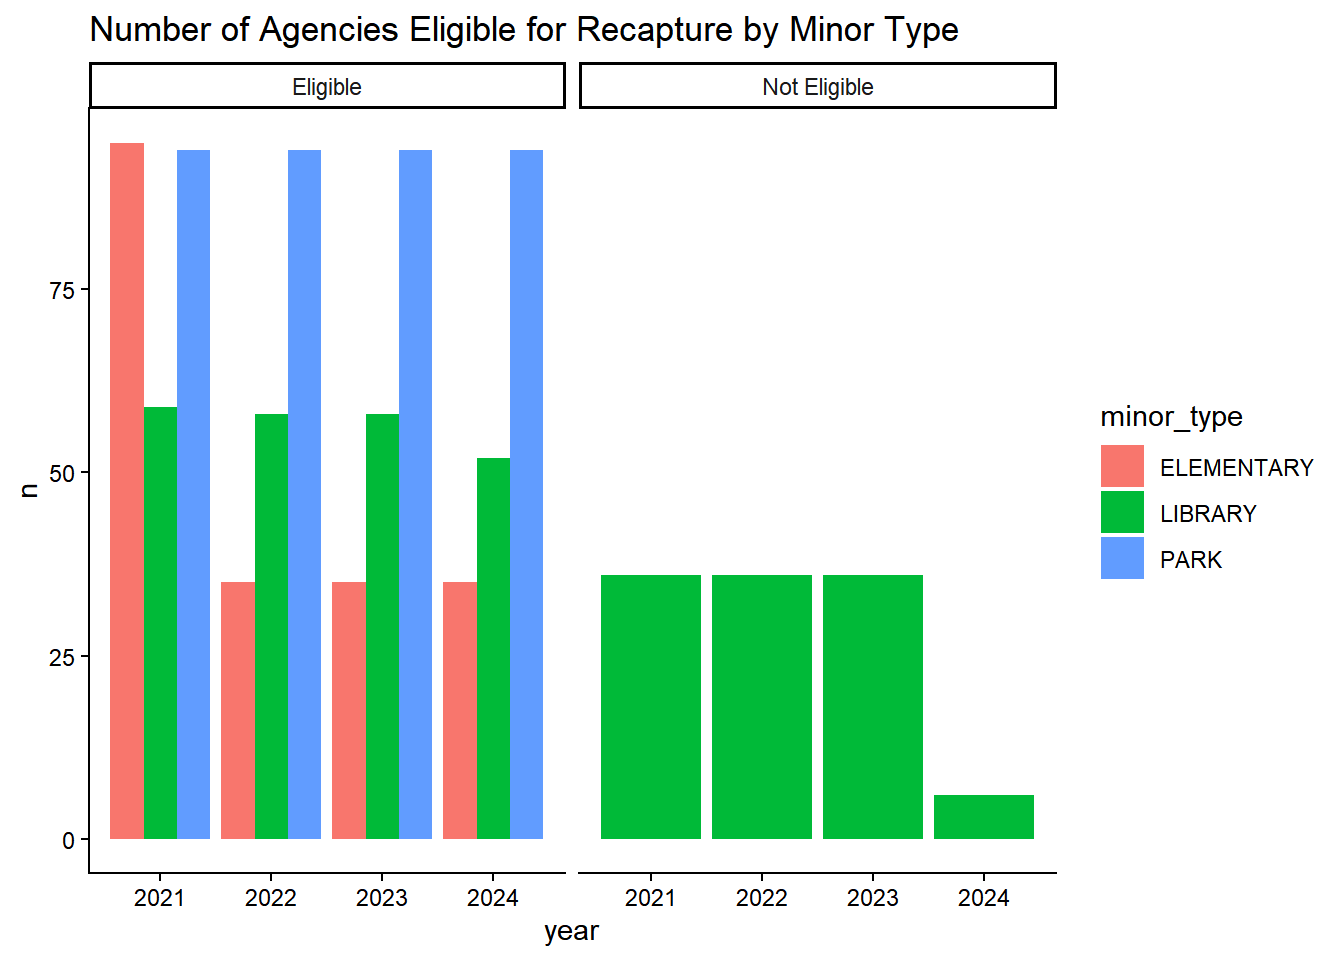
labs(title = "Number of Agencies Eligible for Recapture by Minor Type")
```
```{r}
final_df |>
filter(final_levy>0) |>
group_by(year, major_type, adjust_eligible ) |>
summarize(n = n()) |>
ggplot() +
geom_col(aes(x = year, y = n,, fill = major_type), position = "dodge") +
theme_classic() +
facet_wrap(~adjust_eligible) +
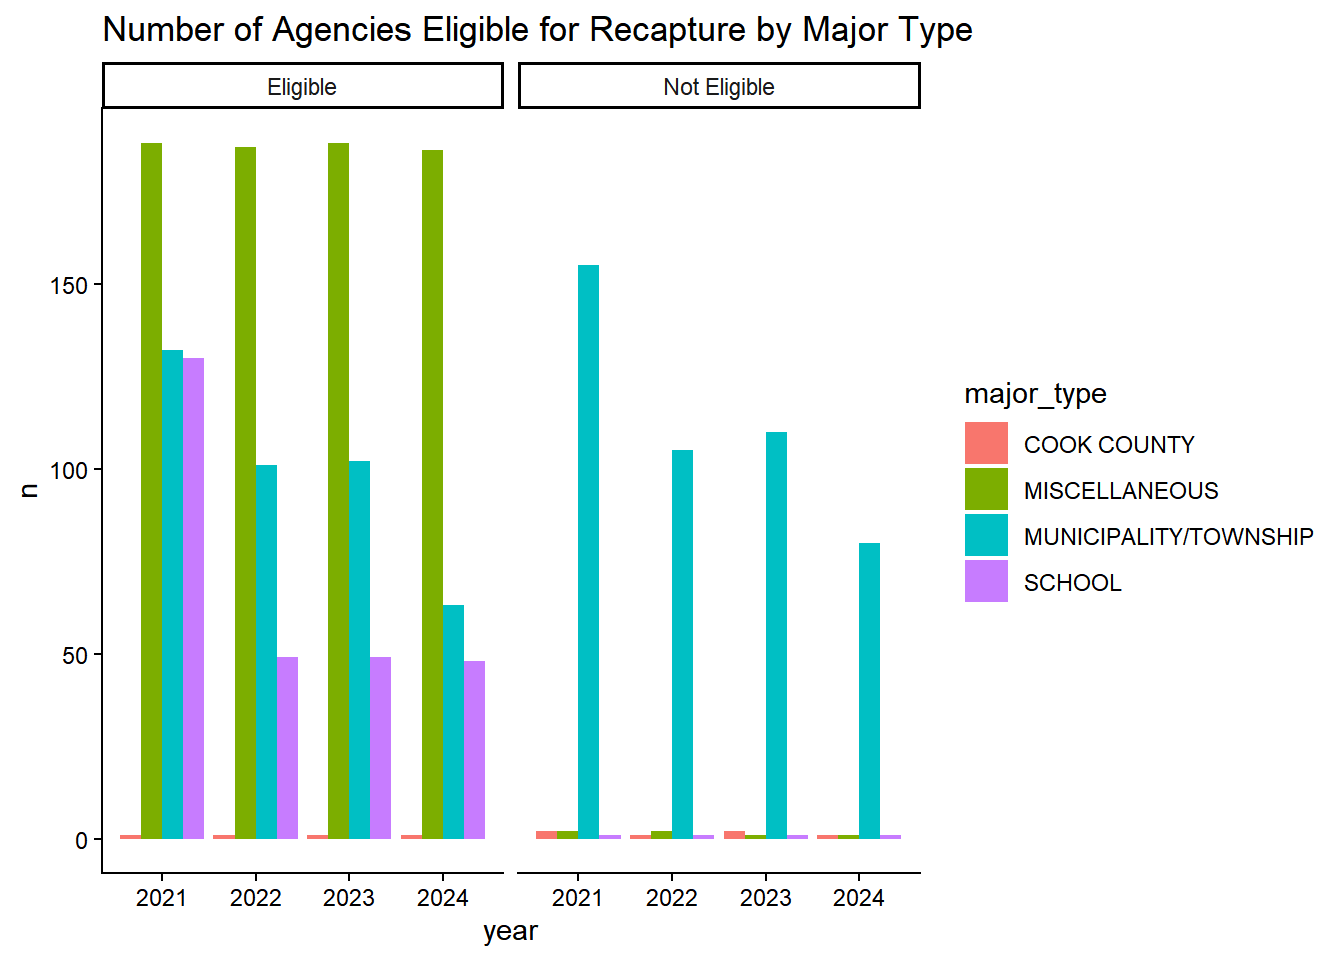
labs(title = "Number of Agencies Eligible for Recapture by Major Type")
```
## Recapture Ratios
```{r}
final_df |>
filter(year > 2020) |>
group_by(agency_name, agency_number) |>
arrange(agency_number, year) |>
mutate(
ratio = fund408 / lag(fund408)) |>
filter(ratio < 5) |>
ggplot() +
geom_line(aes(x=as.character(year), y = ratio, color = major_type, alpha = .5, group = agency_number))+
geom_point(aes(x=as.character(year), y = ratio, color = major_type, alpha = .5) ) +
geom_text(aes(x=as.character(year), y = ratio, label=agency_name, nudge_x = 0.2), check_overlap = TRUE)+
scale_y_continuous(limits = c(0, 6) ) +
labs(title = "Recapture / Previous Year's Recapture", x= element_blank(),
caption = "Excludes agencies where the recapture amount increased
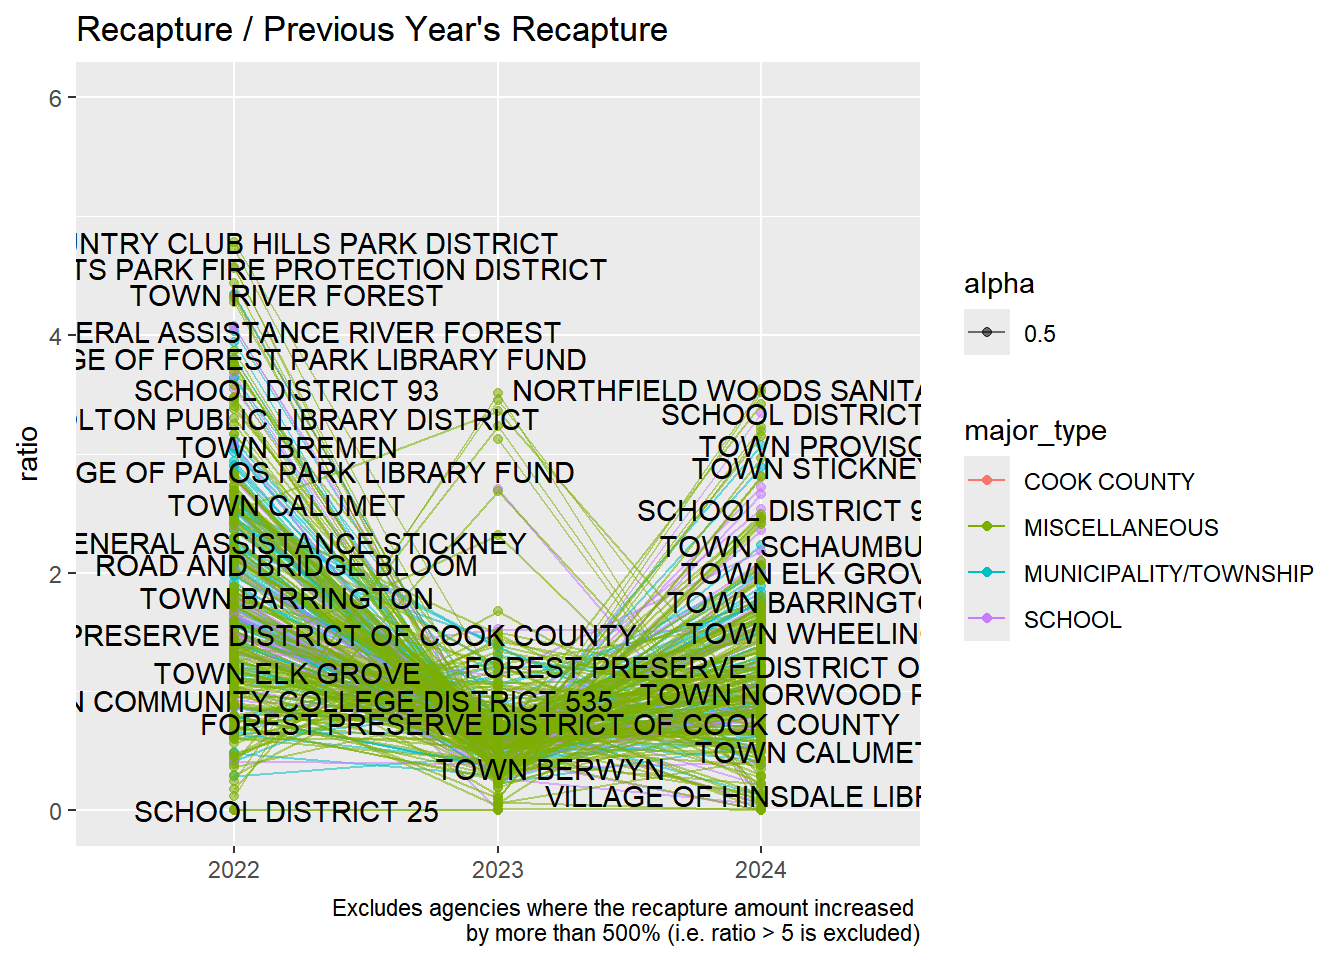
by more than 500% (i.e. ratio > 5 is excluded)")
# geom_jitter(aes(x=year, y = ratio, color = major_type, alpha = .5))
```
```{r}
#| include: false
final_df |>
filter(#year !=2024 &
year > 2020) |>
group_by(agency_name, agency_number) |>
arrange(agency_number, year) |>
mutate(
ratio = fund408 /final_levy) |>
ggplot() +
geom_line(aes(x=as.character(year), y = ratio, color = major_type, alpha = .5, group = agency_number))+
geom_point(aes(x=as.character(year), y = ratio, color = major_type, alpha = .5) ) +
geom_text(aes(x=as.character(year), y = ratio, label=agency_name, nudge_x = 0.2), check_overlap = TRUE)+
labs(title = "Recapture Levy Share", x= element_blank(),
caption = "Recapture Share = Fund 408 Amount/ Final Levy")
final_df |>
filter(#year !=2024 &
year > 2020) |>
group_by(agency_name, agency_number) |>
arrange(agency_number, year) |>
mutate(
ratio = fund408 /final_levy) |>
filter(ratio < .5) |>
ggplot() +
geom_line(aes(x=as.character(year), y = ratio, color = major_type, alpha = .5, group = agency_number))+
geom_point(aes(x=as.character(year), y = ratio, color = major_type, alpha = .5) ) +
geom_text(aes(x=as.character(year), y = ratio, label=agency_name, nudge_x = 0.2), check_overlap = TRUE)+
labs(title = "Recapture Levy Share", x= element_blank(),
caption = "Recapture Share = Fund 408 Amount/ Final Levy.
Excludes > .5 ratios.")
```
```{r}
#| include: false
final_df |>
filter( year > 2020) |>
group_by(agency_name, agency_number) |>
arrange(agency_number, year) |>
mutate(
ratio = levy_adjustment / lag(levy_adjustment)) |>
ggplot() +
geom_line(aes(x=as.character(year), y = ratio, color = major_type, alpha = .5, group = agency_number))+
geom_point(aes(x=as.character(year), y = ratio, color = major_type, alpha = .5) ) +
geom_text(aes(x=as.character(year), y = ratio, label=agency_name, nudge_x = 0.2, nudge_y = 4), check_overlap = TRUE)+
scale_y_continuous(limits = c(0, 200) ) +
labs(title = "Change in Levy Adjustment Variable", x= element_blank(),
caption = "Ratio is levy adjustment for a year / levy adjustment amount for previous year.")
```
```{r}
#| include: false
final_df |>
filter(year > 2020 & adjust_eligible == "Eligible") |>
group_by(agency_name, agency_number) |>
arrange(agency_number, year) |>
mutate(
ratio = -total_refund / levy) |>
ggplot() +
geom_line(aes(x=as.character(year), y = ratio, color = major_type, alpha = .5, group = agency_number))+
geom_point(aes(x=as.character(year), y = ratio, color = major_type, alpha = .5) ) +
labs(title = "Eligible Agencies Only. Ratio = Total Refund / Levy.",
caption = "Looked the same as using Levy Adjustment / Levy", x= element_blank())
```