Supporting Content for Cook County C&I Report

Code
knitr::opts_chunk$set(warning = FALSE, message = FALSE)

options(scipen = 999)

library(tidyverse)
library(glue)
library(sf)
library(DT)
library(flextable)
#install.packages("ggtext")
library(ggtext)

nicknames <- readxl::read_excel("../Necessary_Files/muni_shortnames.xlsx")

cook_sums <- read_csv("../Output/ptaxsim_cook_level_2006to2024.csv") 

muni_sums <- read_csv("../Output/ptaxsim_muni_level_2006to2024.csv")


muni_mc_sums <- read_csv("../Output/ptaxsim_muni_MC_2006to2024.csv") |>
  rename_all(~str_replace(., "muni_mc_", ""))


muni_shp <- read_sf("../Necessary_Files/muni_shp.gpkg")


set_flextable_defaults(theme_fun = theme_vanilla, 
                       padding = 2,
                       line_spacing = 1,
                       big.mark = ",",
                       )

options(DT.options = list())

FitFlextableToPage <- function(ft, pgwidth = 6){

  ft_out <- ft |> autofit()

  ft_out <- width(ft_out, width = dim(ft_out)$widths*pgwidth /(flextable_dim(ft_out)$widths))
  return(ft_out)
}


pin_data <- read_csv(paste0("../Output/Dont_Upload/0_joined_PIN_data_", params$year, ".csv"))


eq_factor <- read_csv("../Necessary_Files/eq_factor.csv") |>
  filter(year == params$year) |>
  select(eq_factor = eq_factor_final) |>
  as.numeric()

incentive_majorclasses <- c("6", "7A", "7B", "8A", "8B")

commercial_classes <- c(401:435, 490, 491, 492, 496:499,
                        500:535,590, 591, 592, 597:599, 
                        700:799,
                        800:835, 891, 892, 897, 899)  

industrial_classes <- c(480:489,493, 
                        550:589, 593,
                        600:699,
                        850:890, 893
                        )
cmap_colors = c("#1e478e", "#6dae4f", "#d3b42b", "#008fd5", "#ca3428", 
                "#ade0ee", "#3e6730", "#d0e4a4")

# All have less than 50 percent of their taxed EAV within Cook County
cross_county_lines <- c(
  # very small amounts in Cook County, like less than 15%:
  # Deer Park, "Frankfort", "Homer Glen",  "Oak Brook", "East Dundee", "University Park",  
 "030270000", "030440000", "030585000", "030890000", "030320000", "031280000",
  
  # 
  # "Bensenville", "Hinsdale", "Roselle", "Deerfield", Elgin, 
  "030080000", "030560000", "031120000",  "030280000",  "030340000", "030270000",
 
  # Closer to ~50% in Cook County
  # Buffalo Grove,  Bartlett,  Burr Ridge, Hanover Park, Steger 
  "030150000","030050000", "030180000","030500000", "031210000"
  )

cross_county_line <- c(
  "Deer Park", "Frankfort", "Homer Glen",  "Oak Brook", "East Dundee", "University Park",  
  "Bensenville", "Hinsdale", "Roselle", "Deerfield", "Elgin",
  "Buffalo Grove",  "Bartlett",  "Burr Ridge", "Hanover Park", "Steger"
                    )

Municipalities that are dropped due to having EAV outside of Cook County: Frankfort, Homer Glen, Oak Brook, East Dundee, University Park, Bensenville, Hinsdale, Roselle, Deer Park, Deerfield, Elgin, Buffalo Grove, Bartlett, Burr Ridge, Hanover Park, Steger.

Code
# Workaround for identifying more project IDs. 
# Used Appeal ID to create unique identifier to group PINs.
bor <- read_csv("../Output/borappeals.csv") |> 
  mutate(project_appellant = paste(project_id, sep = "-", appellant))
# modelsummary::datasummary_skim(bor)


# Cleaned PIN-Project list after cleaning the commercial valuation dataset found online. 
# Another temporary work-around until we (maybe) have full keypin list:
# proj_xwalk <- read_csv("../Output/all_keypins.csv")  
proj_xwalk <-  readxl::read_xlsx("../Output/projects_checked_MAINFILE.xlsx") 
# all commercial valuation properties but made with not-quite-clean data from commercial valuation dataset on Cook County Data Portal (which was made from combining the Methodology worksheets) 
# Values are also only the FIRST PASS assessments and do not include appeals or changes in values

# Join project IDs to PINs:
pin_data <- pin_data |>   
# select(-incent_prop) |> 
  left_join(proj_xwalk |> select(-incent_prop)
)
Code
# original class_dict variables already in 0_joined data
# but I do want the new-ish variables (comparable properties, and land use type) I created in the file to be brought in:
class_dict <- read_csv("../Necessary_Files/class_dict_expanded.csv") |>
  select(class_code, comparable_props, land_use=Alea_cat)


pin_data <- pin_data |> 
  left_join(class_dict, by =  c("class" = "class_code")) |>
  mutate(clean_name = ifelse(is.na(clean_name), "Unincorporated", clean_name)) 
Code
# BOR data source shortfall: We only have the data if they appeal!
# sales data

bor_pins <- bor |> 
  group_by(pin) |> 
  arrange(desc(tax_year)) |>
  summarize(pin = first(pin),              # grabs first occurrence of unique PIN
            class_bor = list(unique(class)),
            appellant = first(appellant),
            project_id = first(project_id), 
            timesappealed = n() ) |>
  mutate(proj_appellant = paste(project_id, "-", appellant))

pin_data <- pin_data |> left_join(bor_pins, by = "pin")

# now do it the other way and compare

pin_data <- pin_data |> 
  mutate( both_ids = project_id,
          both_ids = ifelse(is.na(both_ids), main_keypin, both_ids),
          both_ids = ifelse(is.na(both_ids) & between(class, 300, 899), pin, both_ids))

Total Value should equal Current Taxable Value + non-Taxable Value where non-Taxable Value = Value in TIF Increment + Reduced Value from Policy Choices where Reduced Value = Tax Exempt Value from Homeowners exemptions or abatements + Reduced Taxable Value from lower levels of assessments due to incentive classifications:

\[\mbox{Total Value = Taxed Value + Untaxable Value}\]

where

\[\mbox{Untaxable Value = TIF Increment + Exemptions + Abatements + Reduced Taxable Value from Lower Incentive Class Assessment Ratios}\]

where

\[\mbox{Reduced Taxable Value from Incentive Classification Levels of Assessments}\] \[\mbox{which then equals } {0.25 \ast EAV - \approx0.10 \ast EAV}\]

Cook County Total Value

\[ \mbox{AV = Fair Market Value * Level of Assessment} \]

\[ \mbox{Tax Rate} = \frac{\mbox{Amount Levied by Taxing Districts}}{\mbox{Taxable Value}} \]

Taxed Value refers to what taxing agencies did tax to pay for their levies. We use the portion of the tax bill that does NOT go to TIFs to calculate the portion of the composite levy paid by each PIN and then sum up from there.

\[ \mbox{Final Tax to District} = \mbox{Portion of Levy Paid by PIN} = {\mbox{Tax Code Rate}}*{\mbox{Taxable Value of PIN}} \]

\[\mbox{Equalized Assessed Value} = {\frac{\mbox{final tax to dist + final tax to TIF}}{\mbox{tax code rate}} + \mbox{Exemptions + Abatements}}\]

\[\mbox{Taxed EAV} = {\frac{\sum{final\_tax\_to\_dist}}{\mbox{tax code rate}} = \mbox{EAV - Exemptions - Abatements}}\]

Code
cook_sums |> 
  filter(year == params$year) |>
  select(cty_PC, cty_fmv, cty_fmv_taxed) |>
    mutate(cty_pct_fmv_taxed = scales::percent(cty_fmv_taxed/cty_fmv, accuracy = 0.01)) |>
  flextable() |> 
  set_header_labels(cty_PC = 'PINs', 
                   # cty_projects = "Project IDs", 
                    cty_fmv_taxed = 'Taxed FMV', 
                    cty_fmv_untaxable_value = 'FMV not Taxed\nfor Levy',
                    cty_fmv = 'Total FMV', 

                    cty_pct_fmv_taxed = 'FMV Taxed (%)'
  ) |>   
  FitFlextableToPage()

PINs

Total FMV

Taxed FMV

FMV Taxed (%)

1,859,067

679,122,487,676

560,845,108,013

82.58%

Table 13.1: FMV of PINs in Cook County Taxed FMV represents the property value that was actually taxed by local taxing jurisdictions(equal to the amount levied) but converted to FMV. We use the portion of an individual’s tax bill that does NOT go to a TIF to calculate the composite levy for taxing jurisdictions. This means that the “levy” actually represents the amount collected by the taxing agencies, not the amount that was levied. Therefore the composite levy does not include unpaid taxbills.
Code
tbl <-  cook_sums |>
  filter(year ==params$year) |>
  mutate(cty_pct_fmv_both_incent = cty_fmv_incentive / cty_fmv_comandind ,
         cty_pct_PC_both_incent = cty_PC_withincents / cty_PC_comandind         ) |>
  select(cty_fmv_comandind, #cty_fmv, 
          cty_pct_fmv_both_incent, 
         cty_pct_fmv_incentinTIF,
         cty_pct_PC_both_incent, cty_PC_comandind, cty_PC_incents_inTIFs, #cty_pct_PC_both_incent_inTIF, 
         cty_pct_fmv_incents_tif_increment) |>
 mutate(across(contains("pct_"), scales::percent, accuracy = .01))

tbl |>
  flextable() |> 
  align(align = "right") |>
  set_header_labels(
    cty_fmv_comandind = 'Com. & Ind. FMV',
    #  cty_fmv = 'Total FMV in Cook',
    cty_pct_fmv_both_incent = '% of Com. & Ind. FMV  w/ Incent.',
    cty_pct_fmv_incentinTIF = '% of Com. & Ind. FMV  w/ Incent. in TIF',
    cty_pct_fmv_incents_tif_increment = '% of Com. & Ind. FMV in TIF Increment',
    
    cty_PC_comandind = 'PIN Count',
    cty_PC_incents_inTIFs = "Incent. PINs in TIF",
    cty_pct_PC_both_incent = '% of Com. & Ind. PINs w/ Incent.',
    cty_pct_PC_both_incent_inTIF = '% of Incent. PINs in TIF'
  ) |>
  FitFlextableToPage()

Com. & Ind. FMV

% of Com. & Ind. FMV w/ Incent.

% of Com. & Ind. FMV w/ Incent. in TIF

% of Com. & Ind. PINs w/ Incent.

PIN Count

Incent. PINs in TIF

% of Com. & Ind. FMV in TIF Increment

118,711,589,076

12.60%

39.39%

4.86%

96,431

2,084

28.78%

Table 13.2: Commercial and Industrial PINs in Cook County

12.60% of industrial and commercial PINs (aka "revenue producing PINs") FMV has an incentive classification (4.86% when using PIN counts). Of the PINs that have incentive classification, 39.39% of the FMV is located within a TIF (4.86% when using PIN counts).

28.78% is in TIF Increment.

Code
#table_cook |> 
  
tbl <- cook_sums |>
  filter(year == params$year) |>
  mutate(cty_pct_fmv_com_incent = cty_fmv_comwithincent / cty_fmv_commercial,#) |>
         cty_pct_fmv_com_incent_inTIF = cty_fmv_com_incent_inTIF / cty_fmv_comwithincent,
         
         cty_pct_PC_com_incent_inTIF = cty_PC_com_incent_inTIF / cty_PC_com_incent) |>
  
  select(cty_PC_commercial, cty_PC_com_incent, cty_pct_incent_ofcomPC, 
         cty_pct_PC_com_incent_inTIF, cty_fmv_commercial, cty_pct_incent_ofcomPC, 
         cty_pct_fmv_com_incent, cty_pct_fmv_com_incent_inTIF) |>
  
  mutate(across(contains("pct_"), scales::percent, accuracy = .01))

tbl |>
  flextable() |> 
    align(align = "right") |>
  set_header_labels(cty_fmv_commercial = 'Commercial FMV',
                    cty_PC_commercial = 'Commercial Pin Count', 
                    cty_PC_com_incent = 'Com. PIN Count w/ Incent.',
                    cty_pct_incent_ofcomPC = 'Com. PINs w/ Incent.',
                    cty_pct_fmv_com_incent = '% of Com. FMV  w/ Incent.', 
                    
                    cty_pct_fmv_com_incent_inTIF = '% of Com. FMV  w/ Incent. in TIF', 
                    cty_PC_com_incent_inTIF = "Com. Incent. PINs in TIF", 
                    cty_pct_PC_com_incent = '% of Com. PINs w/ Incent.',
                    cty_pct_PC_com_incent_inTIF = '% of Incent. PINs in TIF'
  ) |>   FitFlextableToPage()

Commercial Pin Count

Com. PIN Count w/ Incent.

Com. PINs w/ Incent.

% of Incent. PINs in TIF

Commercial FMV

% of Com. FMV w/ Incent.

% of Com. FMV w/ Incent. in TIF

70,273

1,033

1.47%

38.82%

89,887,762,331

4.61%

53.19%

Table 13.3: Commercial PINs in Cook County

4.61% of commercial PIN FMV has an incentive classification (1.47% when using PIN counts). Of the PINs that have incentive classification, 53.19% of the FMV is located within a TIF (38.82% when using PIN counts).

Code
tbl <- cook_sums |>
  filter(year == params$year) |>
  mutate(cty_pct_fmv_ind_incent = cty_fmv_indwithincent / cty_fmv_industrial,
         cty_pct_fmv_ind_incent_inTIF = cty_fmv_ind_incent_inTIF / cty_fmv_indwithincent,
         
         cty_pct_PC_ind_incent_inTIF = cty_PC_ind_incent_inTIF / cty_PC_ind_incent) |>
  
  select(cty_PC_industrial, cty_PC_ind_incent, cty_PC_ind_incent_inTIF, 
         cty_pct_incent_ofindPC, cty_pct_fmv_ind_incent_inTIF, cty_pct_PC_ind_incent_inTIF,
         
         cty_fmv_industrial, cty_pct_fmv_ind_incent,  
  ) |>
  mutate(across(contains("pct_"), scales::percent, accuracy = .01)) 

tbl |>
  flextable() |> 
  align(align = "right") |> 
  set_header_labels(cty_fmv_industrial = 'Industrial FMV',
                    cty_PC_industrial = 'Industrial Pin Count', 
                    cty_PC_ind_incent = 'Ind. PIN Count w/ Incent.',
                    cty_pct_incent_ofindPC = 'Ind. PINs w/ Incent.',
                    cty_pct_fmv_ind_incent = '% of Ind. FMV  w/ Incent.', 
                    
                    cty_pct_fmv_ind_incent_inTIF = '% of Ind. FMV  w/ Incent. in TIF', 
                    cty_PC_ind_incent_inTIF = "Ind. Incent. PINs in TIF", 
                    cty_pct_PC_ind_incent = '% of Com. PINs w/ Incent.',
                    cty_pct_PC_ind_incent_inTIF = '% of Incent. PINs in TIF'
  ) |> 
  FitFlextableToPage()

Industrial Pin Count

Ind. PIN Count w/ Incent.

Ind. Incent. PINs in TIF

Ind. PINs w/ Incent.

% of Ind. FMV w/ Incent. in TIF

% of Incent. PINs in TIF

Industrial FMV

% of Ind. FMV w/ Incent.

26,158

3,658

1,683

13.98%

34.10%

46.01%

28,823,826,745

37.51%

Table 13.4: Industrial PINs in Cook County

37.51% of industrial FMV has an incentive classification (13.98% when using PIN counts). Of the PINs that have incentive classification, 34.10% of the FMV is located within a TIF ( 46.01% when using PIN counts).

Code
cook_sums |>
  filter(year == params$year) |>
  select(cty_fmv, cty_fmv_tif_increment, cty_fmv_exemptions, cty_fmv_abatements, 
         ) |>
mutate(cty_pct_fmv_untaxable = (cty_fmv_tif_increment + cty_fmv_exemptions + cty_fmv_abatements)/cty_fmv) |>
  mutate(across(contains("pct_"), scales::percent, accuracy = .01)) |>
  flextable() |> 
    align(align = "right") |>  
  set_header_labels(
                   cty_fmv = 'Total FMV', 
                    cty_fmv_tif_increment = 'TIF Increment FMV' ,
                    cty_fmv_exemptions = 'Exempt Value: Exemptions',
                    cty_fmv_abatements = 'Exempt Value: Abatements',
                 #   cty_fmv_untaxable_value = 'Value not Taxable \nfor Levy',
                    cty_pct_fmv_untaxable = 'County FMV not Taxed (%)'
                 ) |>
  FitFlextableToPage()

Total FMV

TIF Increment FMV

Exempt Value: Exemptions

Exempt Value: Abatements

County FMV not Taxed (%)

679,122,487,676

61,784,381,147

56,141,291,078

0

17.36%

Table 13.5: Untaxable FMV in Cook County.
Code
cook_sums |>
  filter(year == params$year) |>  
  select(cty_av, cty_av_taxed, cty_untaxable_value_av, cty_pct_av_taxed, cty_pct_av_untaxable ) |>
  mutate(across(contains("pct_"), scales::percent, accuracy = .01)) |>
  flextable() |> 
    align(align = "right") |>  set_header_labels(
                   cty_av = 'Total AV', 
                    cty_av_taxed = 'Taxed AV' ,
                    cty_untaxable_value_av = 'AV Not Taxed',
                    cty_pct_av_taxed = '% Taxed',
                    cty_pct_av_untaxable = '% Not Taxed') |>
   FitFlextableToPage()

Total AV

Taxed AV

AV Not Taxed

% Taxed

% Not Taxed

83,458,163,843

68,596,533,659

16,409,549,964

82.19%

19.66%

Table 13.6: Untaxable AV in Cook County. Taxed AV represents the property value that was actually taxed by local taxing jurisdictions.
Code
cook_sums |>
  filter(year == params$year) |>
  select(cty_fmv, cty_fmv_inTIF, cty_fmv_tif_increment, 
         cty_fmv_incentive, cty_fmv_incents_inTIFs, cty_fmv_incents_tif_increment) |>
  flextable() |> 
  set_header_labels(
                    cty_fmv = 'Total FMV', 
                    cty_fmv_inTIF = 'FMV in TIFs',
                    cty_fmv_tif_increment = 'TIF Increment FMV' ,
                    cty_fmv_incents_inTIFs = 'FMV from Incent. Class in TIF',
                    cty_fmv_incentive = "FMV with Incent.Class.", 
                    cty_fmv_incents_tif_increment = 'FMV with Incent. Class. in TIF Increment') |>   
  FitFlextableToPage()

Total FMV

FMV in TIFs

TIF Increment FMV

FMV with Incent.Class.

FMV from Incent. Class in TIF

FMV with Incent. Class. in TIF Increment

679,122,487,676

120,932,595,191

61,784,381,147

14,956,985,713

5,891,556,760

4,305,354,674

Table 13.7: FMV of properties with incentive classifications and TIF increment. Value in TIFs, value within the TIF that can be taxed by local taxing jurisdictions, value of properties that have reduced levels of assessments from incentive classifications, and the value that is both in a TIF and has a reduced LOA.

Taxed value is the amount of value that was actually taxed in order to pay for taxing agencies levies. It includes frozen EAV within an area + taxable EAV for residential properties net exemptions and abatements. It also includes the equalized assessed value of incentive properties at their current, lower assessment ratios. final_tax_to_dist is used to calculate the amount that was collected by local government agencies and then divided by the tax rate to calculate the amount of value that was taxed, or the taxable equalized assessed value (TEAV).

The Taxed Value, when converted to the Fair Market Value (FMV) represents the amount of value that was taxed out of the full FMV available in Cook County.

Untaxable EAV includes homeowner exemptions for 200 level properties, abatements for other property class types, EAV in the TIF increment, and EAV that has been reduced due to incentive classifications.

Code
cook_MC_sums <- read_csv("../Output/ptaxsim_cook_MC_level_2006to2024.csv") 

cook_MC_sums |>  
  filter(year == params$year) |>
      mutate(across(contains(c("pct_", "rate")), scales::percent, accuracy = .01)) |>
      mutate(across(is.numeric, round, digits = 0)) |>

  select(
    "Property Type" = class_group, 
    "Homeowner Exempt FMV"= cty_mc_fmv_exemptions,
    "Abated FMV" = cty_mc_fmv_abatements,
    "$0 Bill Count" = cty_mc_zero_bill,
    "$ Levy Paid" = cty_mc_levy,
  #  "% of Levy Paid" =  pct_mc_levy_paid, 
    "FMV in Major Class" =  cty_mc_fmv,
    "Taxed AV" = cty_mc_av_taxed,
   # "Project Count" = cty_mc_projects,
    "Avg Composite Tax Rate" = cty_mc_current_rate_avg,
 'FMV in TIFs' = cty_mc_fmv_inTIF, 
   'TIF Increment FMV' = cty_mc_fmv_tif_increment)  |> 
  flextable() |> 
  align(align = "right")

Property Type

Homeowner Exempt FMV

Abated FMV

$0 Bill Count

$ Levy Paid

FMV in Major Class

Taxed AV

Avg Composite Tax Rate

FMV in TIFs

TIF Increment FMV

0

0

0

93,279

14,361

0

52,480

9.86%

0

0

1

0

0

5,029

110,431,839

5,446,604,190

419,892,652

10.24%

2,389,141,250

1,113,782,921

2

56,127,802,945

0

24,663

10,557,379,804

499,767,211,980

41,780,428,821

9.11%

57,158,146,720

25,801,076,108

3

188,839

0

29

998,308,846

54,074,286,640

4,385,238,578

8.19%

16,767,153,840

10,138,872,450

4

0

0

6

23,307,608

601,863,935

99,164,739

9.31%

286,875,585

106,040,209

5A

13,210,489

0

509

4,130,663,966

85,156,134,688

17,427,701,620

9.12%

30,720,749,976

15,394,260,529

5B

88,805

0

40

946,587,981

17,996,604,740

3,325,439,744

9.22%

7,200,083,220

4,692,359,430

6

0

0

1

236,377,492

9,747,786,025

761,017,479

10.59%

3,121,976,440

2,138,159,522

7A

0

0

0

9,129,465

468,038,430

35,319,406

9.68%

250,674,677

157,452,280

7B

0

0

21

37,422,505

3,172,185,693

174,481,796

8.14%

1,712,364,163

1,433,528,815

8A

0

0

0

22,336,030

506,111,295

44,221,512

17.75%

242,557,120

99,325,050

8B

0

0

0

28,649,246

1,062,864,270

58,052,385

19.68%

563,984,360

476,889,007

9

0

0

6

19,749,267

1,122,795,790

85,522,448

8.20%

518,887,840

232,634,824

The Fair Market Value (FMV) is also called the Market Value for Assessment Purposes and can be calculated from the av / loa, or the Assessed Value divided by the Level of Assessment. However, the values used for the level of assessment are an approximation for incentive properties since we do not have the PIN level assessment ratios.

Municipality Level Stats

Ignore stats for these Municipalities. Simple rounding errors may cause bizarre results for rate changes & other calculations. These municipalities are dropped from summary tables in this website but are included in exported files.

  • Frankfort has 1 PIN in Cook County
  • East Dundee has 2
  • Homer Glen has 3
  • University Park has 4
  • Oak Brook, Deer Park, Deerfield, & Bensenville each have less than 75 PINs in Cook County, IL

Frequency of Incentives

Fair Market Value of Incentive PINs

Code
landuse_incentshares <- pin_data |>  
  filter(!agency_num %in% cross_county_lines) |>

  filter(land_use != "Land") |>
  group_by(clean_name, land_use) |> 
  summarize(pin_count = n(),
            incent_PC = sum(ifelse(class >=600 & class <=900, 1, 0), na.rm=TRUE),
            fmv_incentive = sum(ifelse(class >=600 & class <=900, fmv, 0), na.rm = TRUE),
            fmv_group = sum(fmv, na.rm=TRUE),
  ) |>
  mutate(
    fmv_incentive = ifelse(fmv_incentive == 0, NA, fmv_incentive),
    pct_incent = fmv_incentive / fmv_group,
    pct_incent = ifelse(is.na(pct_incent), 0, pct_incent),
pct_incent = scales::percent(pct_incent)
)  

indust_top10 <- landuse_incentshares |>
  select(clean_name, land_use, fmv_incentive, incent_PC) |> 
  filter(land_use == "Industrial") |>
  arrange(desc(fmv_incentive)) |>
  head(10) |> 
  select(-land_use)

indust_top10 |>
  flextable() |> 
  set_header_labels(clean_name = "Municipality", incent_PC = '# of Incent. PINs',
fmv_incentive = "FMV from Incentive\nClass Properties"
) |>
  set_table_properties( layout = "autofit", width = .75)

Municipality

FMV from Incentive
Class Properties

# of Incent. PINs

Chicago

1,979,059,970

493

Elk Grove Village

935,174,200

210

Franklin Park

833,824,150

84

Bedford Park

671,990,980

154

North Lake

636,227,120

21

Melrose Park

606,945,600

117

Des Plaines

355,953,705

59

Matteson

337,527,380

16

Mc Cook

315,423,540

48

Mt Prospect

291,506,020

48

Table 13.8: Top 10 Municipalities using Industrial Incentives
Code
commerc_top10 <- landuse_incentshares |>
  select(clean_name, land_use, fmv_incentive, incent_PC) |> 
  filter(land_use == "Commercial") |>
  arrange(desc(fmv_incentive)) |>
  head(10) |> 
  select(-land_use)
  
commerc_top10 |>
  flextable() |> 
#align(align = "right", j = 2:4) |>
  set_header_labels(clean_name = "Municipality", 
                    incent_PC = '# of Incent. PINs', 
                    fmv_incentive = "FMV from Incentive\nClass Properties"
                    ) |>
  set_table_properties( layout = "autofit", width = .75)

Municipality

FMV from Incentive
Class Properties

# of Incent. PINs

Chicago

3,217,094,693

223

Glenview

71,563,900

3

Matteson

63,645,520

24

Evergreen Park

51,106,697

6

Calumet City

41,480,025

73

South Holland

41,391,110

51

Chicago Heights

32,634,725

69

Orland Park

29,190,280

10

Oak Forest

28,584,525

34

Melrose Park

27,004,127

6

Table 13.9: Top 10 Municipalities using Commercial Incentives

Share of Total FMV with Incentive Classification

Combined Industrial and Commercial FMV with incentive classification divided by total FMV in municipality. Not included in a table in the report.

One way of showing areas that have reduced their tax base significantly through the use of incentive classifications.

Code
table_muni_percentages <- muni_sums |>   
  filter(year == params$year)|>
  filter(!clean_name  %in% cross_county_line)


muni_count <- n_distinct(table_muni_percentages$clean_name)
no_incents <- n_distinct(table_muni_percentages$clean_name[table_muni_percentages$pct_fmv_w_incentclass == 0])
median = round(muni_count/2)
median_5 = c( (median-2) : (median+2) )
bottom_5 = c( (muni_count-4) : muni_count )

table_muni_percentages |>
  select(clean_name, pct_fmv_w_incentclass) |> 
  arrange(desc(pct_fmv_w_incentclass)) |>
  slice(c(1:5, median_5)) |>
  
  mutate(pct_fmv_w_incentclass = scales::percent(pct_fmv_w_incentclass, digits = 2)) |>
  flextable() |> 
  border_remove() |>
  hline_top() |>
  hline(i = c(5,10)) |>
  
  set_header_labels(clean_name = "Municipality", pct_fmv_w_incentclass = "% FMV") |>
  add_footer_lines(top = FALSE, values = paste0("There are ", no_incents, "  municipalities that do not use incentives and have a majority of their taxable EAV within Cook County.") ) |>
  
  align(j = 2, align = "right") |>
  align(j=2, align = "right", part = "header") |>
  bold(i = 8) |>

  set_table_properties( layout = "autofit")

Municipality

% FMV

Mc Cook

59.50%

Bedford Park

48.60%

North Lake

37.50%

Markham

31.40%

Franklin Park

28.00%

Chicago Ridge

1.50%

Hazelcrest

1.50%

Chicago

1.40%

Palatine

1.40%

Tinley Park

1.40%

There are 29 municipalities that do not use incentives and have a majority of their taxable EAV within Cook County.

Table 13.10: Municipalities with the largest share of FMV property with incentive classification.
Code
library(sf)
library(ggpattern)

no_incentives <-  pin_data |> 
  group_by(clean_name) |> 
  filter(sum(incent_prop) == 0) |> 
  distinct(clean_name)


no_incentives <- no_incentives |>
  left_join(muni_shp, by = c("clean_name" = "MUNICIPALITY")) 

# unincorp_areas <- muni_shp |> filter(!MUNICIPALITY %in% munilevel$clean_name)
#anti_join(munilevel, muni_shp, by = c("clean_name" = "MUNICIPALITY"))

# unincorp_areas2 <- muni_shp |> filter(!MUNICIPALITY %in% munilevel$shpfile_name)
Code
table_muni_percentages |>
    left_join(nicknames) |>

  select(clean_name, pct_fmv_w_incentclass, shpfile_name) |>
 filter(!is.na(clean_name) & clean_name != "Unincorporated" ) |>
  full_join(muni_shp, by = c("shpfile_name" = "MUNICIPALITY")) |>
  
  ggplot(aes(fill = pct_fmv_w_incentclass)) +
  geom_sf(aes(geometry = geom), color = "black") +
  theme_void() + 
  theme(axis.ticks = element_blank(), axis.text = element_blank())+
  scale_fill_steps2(
    high = "brown", low = "black",
    show.limits=TRUE,
    nice.breaks=FALSE,
    na.value="gray",
    n =4,
    name = "Municipality FMV\nwith Incentive\nClassification",
    labels = scales::percent
) +
   geom_sf_pattern(data = no_incentives, aes(geometry = geom), pattern = 'crosshatch', pattern_spacing = 0.015, pattern_density = 0.1, fill = "white", alpha = .5, color = 'gray40')
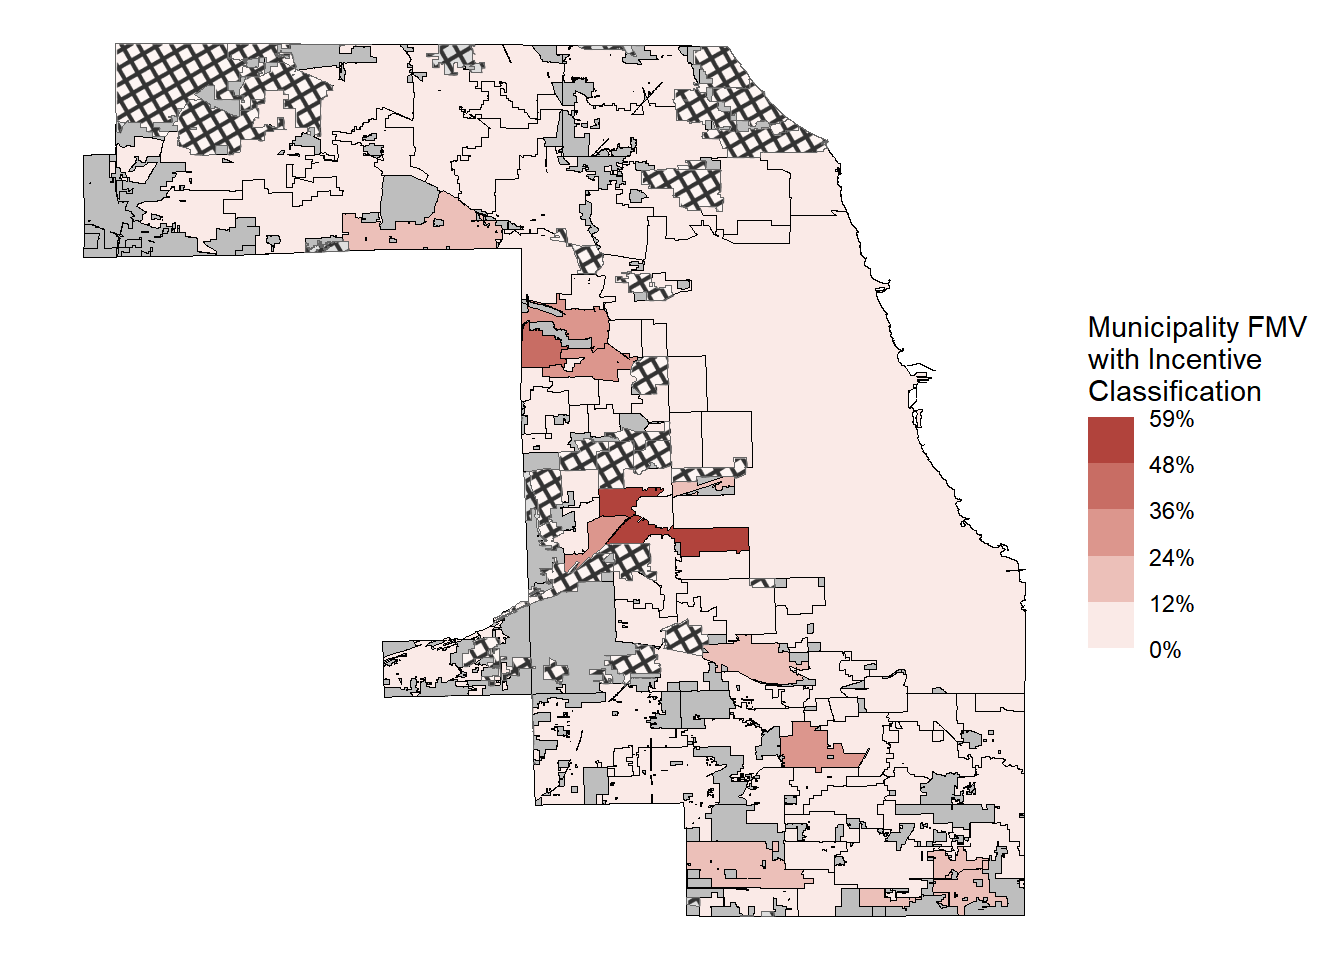
Figure 13.1: Percent of Municipality FMV with Incentive Classification % = FMV from Incentive Class properties / Muni FMV
Code
table2 <- pin_data |> 
    filter(land_use != "Land") |>
  group_by(clean_name, incent_prop) |>   # projects can be counted twice if the project has incentive and normal commercial/industrial prop classes.
  summarize(pin_count = n(),
         project_count = n_distinct(main_keypin), 
         av_adjusted=sum(ifelse(between(class, 600, 899), av*2.5, av)),
         av=sum(av, na.rm=TRUE),
fmv=sum(fmv)) 

datatable(table2,
          rownames= FALSE,
          colnames = c('Municipality' = 'clean_name',   
                       'Incentivized?' = 'incent_prop', 
                       'PIN Count' = 'pin_count', 
                       'Project Count' = 'project_count', 
                       'Taxable AV' = 'av',
                       'AV w/o Incentive Classification' = 'av_adjusted',
                       'FMV' = 'fmv')) |>
  formatCurrency(c('Taxable AV',  'AV w/o Incentive Classification', 'FMV'), digits = 0)
Table 13.11: PINs and value summarized by if the property has an incentive class or not in a municipality. AV Adjusted is the amount of assessed value that could be taxed if the property were assessed at 25% instead of the lower level of assessment of approximately 10%.

Share of Commercial & Industrial FMV with Incentive Classification

Code
muni_incent_share <- pin_data |> 
  # drop munis mostly outside of Cook and unincorporated PINs
filter(!agency_num %in% cross_county_line & 
         !is.na(clean_name) ) |>

  filter(land_use == "Industrial" | land_use == "Commercial") |>
  group_by(clean_name, agency_num) |> 
  summarize(pin_count = n(),
            incent_PC = sum(ifelse(class >=600 & class <900, 1, 0), na.rm=TRUE),
            fmv_w_incent = sum(ifelse(class >=600 & class <900, fmv, 0), na.rm = TRUE),
           # project_count = n_distinct(main_keypin),
            fmv_group = sum(fmv, na.rm=TRUE),
            comind_fmv =sum(fmv, na.rm=TRUE),
            pins_inTIF = sum(in_tif, na.rm=TRUE)) |>
  mutate(
    fmv_w_incent = ifelse(fmv_w_incent == 0, NA, fmv_w_incent),
    pct_fmv_w_incent = fmv_w_incent/comind_fmv,
    pct_fmv_w_incent = ifelse(is.na(pct_fmv_w_incent), 0, pct_fmv_w_incent)) |>  
  select(clean_name, pct_fmv_w_incent, agency_num, fmv_w_incent, comind_fmv) 


muni_count <- n_distinct(muni_incent_share$clean_name)
no_incents <- n_distinct(muni_incent_share$clean_name[muni_incent_share$pct_fmv_w_incent == 0])
median = round(muni_count/2)
median_5 = c( (median-2) : (median+2) )
bottom_5 = c( (muni_count-4) : muni_count )


muni_incentshare_slice <- muni_incent_share  |>
  ungroup() |>
  
  filter(!agency_num %in% cross_county_lines) |>
  mutate(pct_fmv_w_incentclass = fmv_w_incent/comind_fmv,
         pct_fmv_w_incentclass = ifelse(is.na(pct_fmv_w_incentclass), 0, pct_fmv_w_incentclass)) |>
    select(clean_name, pct_fmv_w_incentclass) |>

  arrange(desc(pct_fmv_w_incentclass)) |>
  mutate(pct_fmv_w_incentclass = scales::percent(pct_fmv_w_incentclass, accuracy = 0.01 ) ) |>
  slice(c(1:5, median_5))

muni_incentshare_slice |>
  flextable() |> 
  border_remove() |>
  align(j = 2, align = "right", part = "all") |>
  hline_top() |>
  hline(i = c(5,10)) |>
  set_header_labels(clean_name = "Municipality", pct_fmv_w_incentclass = "% FMV with\nIncent. Class.") |>
  add_footer_lines(top = FALSE, values = c(paste0("There are ", no_incents, " municipalities that do not use incentives and have a majority of their taxable EAV within Cook County.") )) |>
  bold(i = 8) |>
  set_table_properties( layout = "autofit")

Municipality

% FMV with
Incent. Class.

Markham

77.50%

Sauk Village

73.33%

North Lake

66.09%

Country Club Hills

65.77%

Mc Cook

62.93%

Merrionette Park

9.85%

Palos Heights

9.76%

Countryside

9.57%

Arlington Heights

9.27%

Forest Park

8.42%

There are 31 municipalities that do not use incentives and have a majority of their taxable EAV within Cook County.

Table 13.12: Municipalities with the largest share of Commercial and Industrial property with incentive classification. Uses values obtained from PTAXSIM, and levels of assessment from CCAO’s Github.
Code
figure7 <- muni_incent_share |>
  select(clean_name, pct_fmv_w_incent) |>
  left_join(nicknames)|>
filter(clean_name != "Unincorporated") |>
  full_join(muni_shp, by = c("shpfile_name" = "MUNICIPALITY")) 

figure7$pct_fmv_w_incent <- cut(
  figure7$pct_fmv_w_incent,
  breaks = c(0, 0.075, 0.15, 0.22, 0.30, as.numeric(max(muni_incent_share$pct_fmv_w_incent))),
  labels = c(
    "<7.5%",
    "7.5–14.99%",
    "15.0–21.99%",
    "22.0–29.99%",
    "≥30%"
  ),
  include.lowest = TRUE
)

    # Define color palette
exemption_colors <- c(
  "<7.5%" = "#ffffcc",
  "7.5–14.99%" = "lightblue",
  "15.0–21.99%" = "#4292C6",
  "22.0–29.99%" = "#253494",
  "≥30%" = "#00004d")
    

figure7 |>
  ggplot(aes(fill = pct_fmv_w_incent)) +
  geom_sf(aes(geometry = geom), color = "black") +
  theme_void() + 
  theme(axis.ticks = element_blank(), axis.text = element_blank())+
  scale_fill_manual(
          na.value = "gray50",
          name = "% Exempt",
          values = exemption_colors,
          na.translate = FALSE
        ) +
#   scale_fill_steps2(
#     high = "#1e478e", low = "black",
#     show.limits=TRUE,
#     nice.breaks=FALSE,
#     na.value="gray",
#     n =4,
#     name = "C&I FMV with\nIncentive Class",
#     labels = scales::percent
# ) +
  
     # scale_fill_stepsn(colors = c("#ffffcc","#a1dab4" ,"#41b6c4","#2c7fb8", "#253494"),
     #                    show.limits=TRUE, 
     #                 limits = c(0,1),
     #                 na.value = "white", # "gray70",
     #                 n.breaks = 6,
     #                    name = "Burden with \nExemptions", 
     #                 labels = scales::percent
     #                 
     #                )+
   geom_sf_pattern(data = no_incentives, aes(geometry = geom), pattern = 'crosshatch', pattern_spacing = 0.015, pattern_density = 0.1, fill = "white", alpha = .5, color = 'gray40')+
  ggtitle(label = "Commercial & Industrial FMV with Incentive Classification")
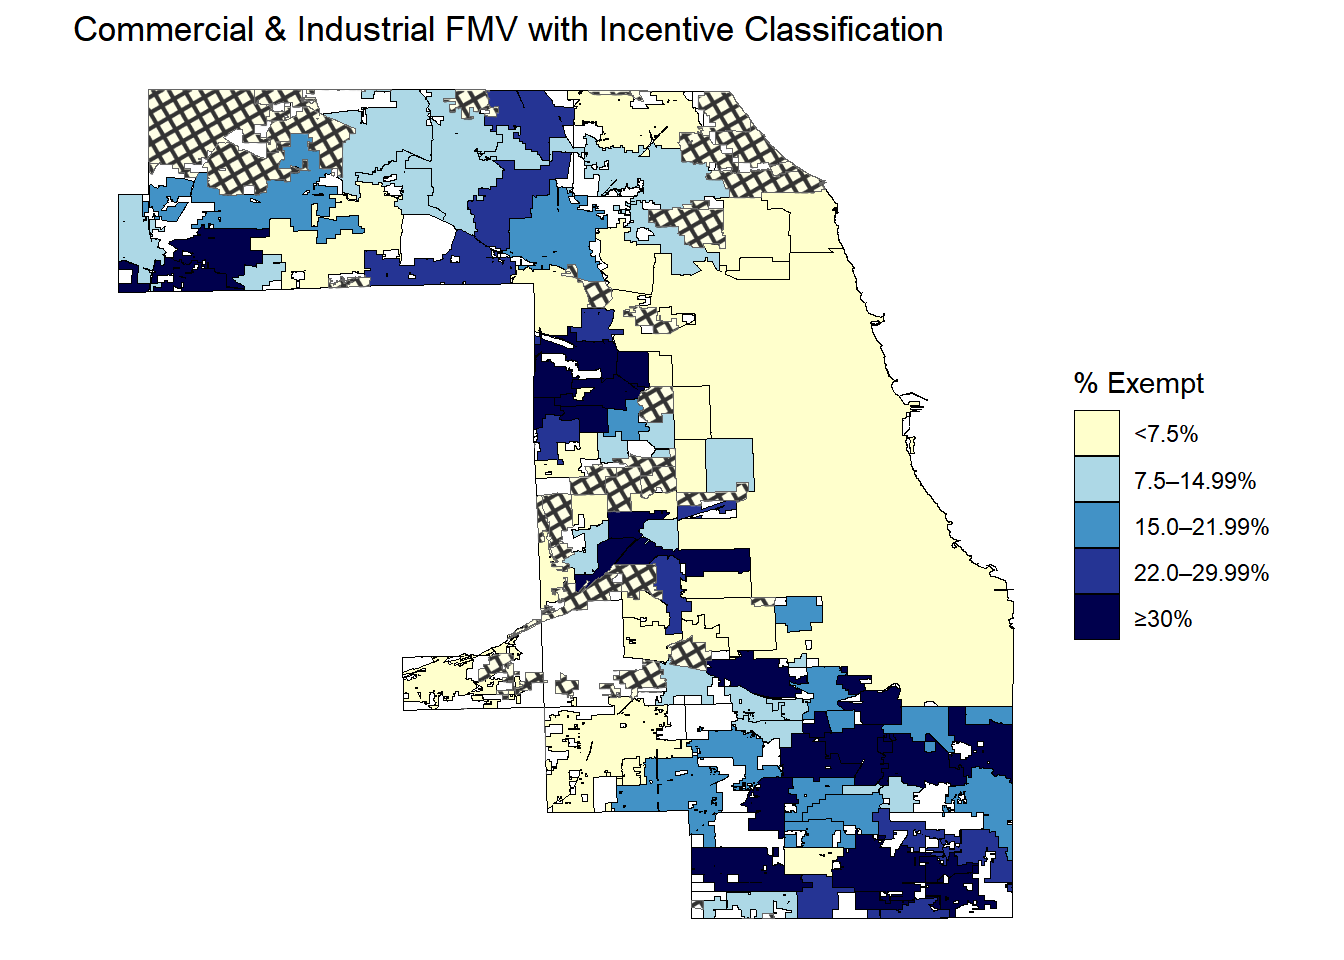
Figure 13.2: Share of Commercial and Industrial FMV that has an incentive property class.
Code
figure7alt <- muni_incent_share |>
  select(clean_name, pct_fmv_w_incent) |>
  left_join(nicknames)|>
filter(clean_name != "Unincorporated") |>
  full_join(muni_shp, by = c("shpfile_name" = "MUNICIPALITY")) 

figure7alt$pct_fmv_w_incent_label <- cut(
  figure7alt$pct_fmv_w_incent,
  breaks = c(0, 0.15, 0.30, 0.45, 0.60, as.numeric(max(muni_incent_share$pct_fmv_w_incent))),
  labels = c(
    "<15%",
    "15–29.99%",
    "30–44.99%",
    "45–59.99%",
    "≥60%"
  ),
  include.lowest = TRUE
)

# Define color palette
exemption_colors <- c(
  "<15%" = "#ffffcc",
  "15–29.99%" = "lightblue",
  "30–44.99%" = "#4292C6",
  "45–59.99%" = "#253494",
  "≥60%" = "#00004d")


figure7alt |>
  ggplot(aes(fill = pct_fmv_w_incent_label)) +
  geom_sf(aes(geometry = geom), color = "black") +
  theme_void() + 
  theme(axis.ticks = element_blank(), axis.text = element_blank())+
  scale_fill_manual(
          na.value = "gray50",
          name = "% Exempt",
          values = exemption_colors,
          na.translate = FALSE
        ) +
   geom_sf_pattern(data = no_incentives, aes(geometry = geom), pattern = 'crosshatch', pattern_spacing = 0.015, pattern_density = 0.1, fill = "white", alpha = .5, color = 'gray40')+
  ggtitle(label = "Commercial & Industrial FMV with Incentive Classification")
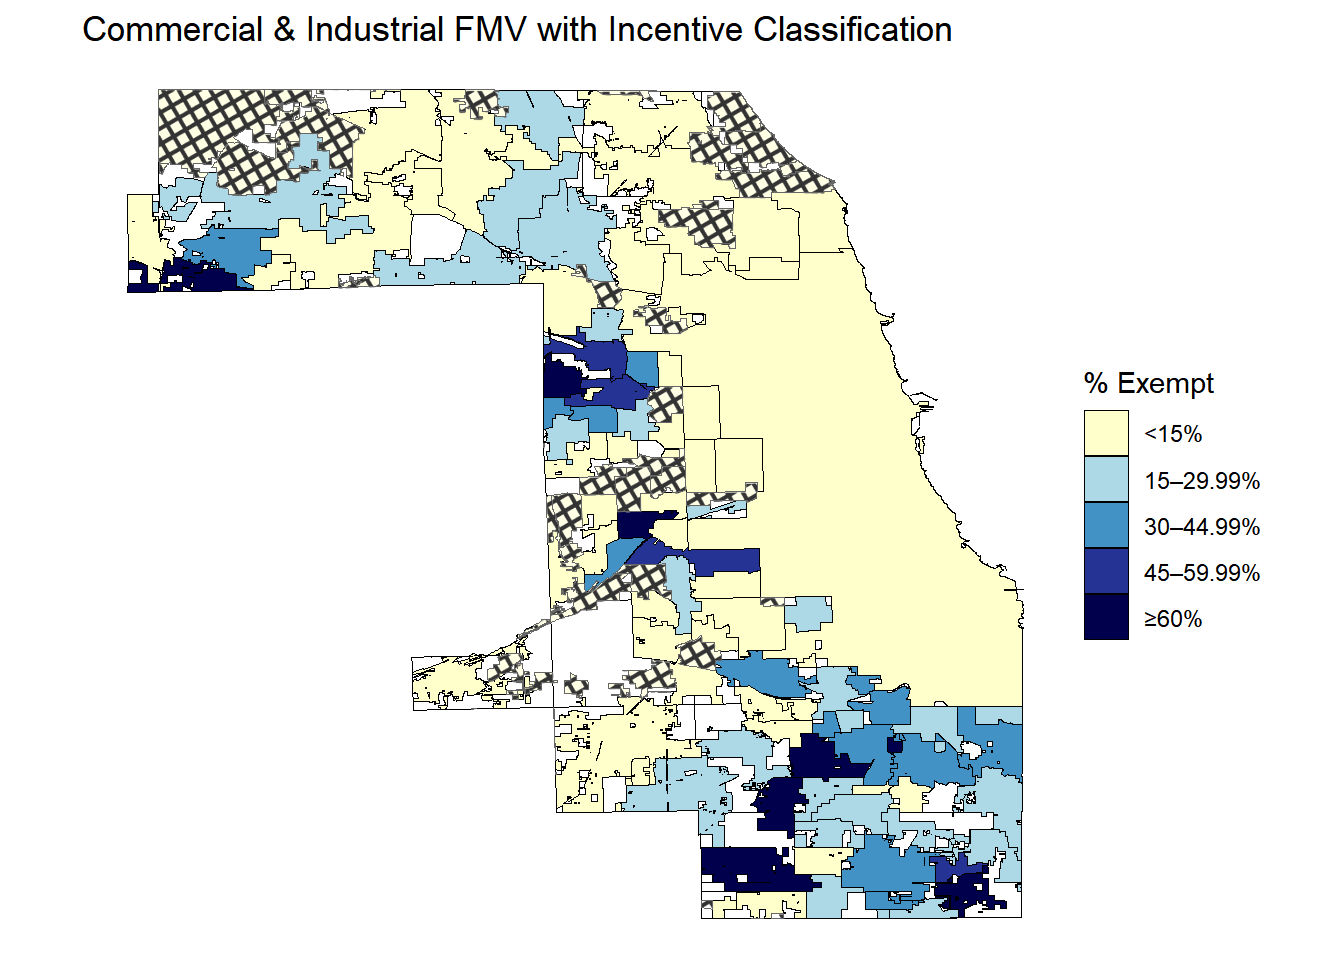
Figure 13.3: Share of Commercial and Industrial FMV that has an incentive property class.

Share of Industrial FMV with Incentive Classification within each Municipality

Code
indust_share_full <- muni_sums  |>
  
  filter(year == params$year & !clean_name %in% cross_county_line) |>
  ungroup() |>
  mutate(pct_fmv_indust_incent =  muni_fmv_indust_incent/muni_fmv_industrial,
         pct_fmv_indust_incent = ifelse(is.na(pct_fmv_indust_incent), 0, pct_fmv_indust_incent)) |>
  select(clean_name, pct_fmv_indust_incent) |> 
  arrange(desc(pct_fmv_indust_incent)) 

muni_count <- n_distinct(indust_share_full$clean_name)
no_incents <- n_distinct(indust_share_full$clean_name[indust_share_full$pct_fmv_indust_incent == 0])
median = round(muni_count/2)
median_5 = c( (median-2) : (median+2) )
bottom_5 = c( (muni_count-4) : muni_count )

indust_share <- indust_share_full |>
  slice(c(1:5, median_5)) |>
  mutate(pct_fmv_indust_incent = scales::percent(pct_fmv_indust_incent, accuracy = 0.01 ) ) 

indust_share |>
  flextable() |> 
  border_remove() |>
  align(j = 2, align = "right", part = "all") |>
  hline_top() |>
  hline(i = c(5,10)) |>
  set_header_labels(clean_name = "Municipality", pct_fmv_indust_incent = "% FMV with\nIncent. Class.") |>
  add_footer_lines(top = FALSE, values = paste0("There are ", no_incents, "  municipalities that do not use incentives and have a majority of their taxable EAV within Cook County.") ) |>
  bold(i = 8) |>
  set_table_properties( layout = "autofit")

Municipality

% FMV with
Incent. Class.

Country Club Hills

94.65%

Markham

91.31%

Homewood

90.55%

North Lake

88.17%

Matteson

84.64%

Niles

24.03%

Skokie

23.11%

Palos Hills

23.02%

Hazelcrest

21.51%

Chicago

21.27%

There are 37 municipalities that do not use incentives and have a majority of their taxable EAV within Cook County.

Table 13.13: Percent of Industrial FMV within each Municipality that has incentive classification. 37 municipalities do not use industrial incentives.
Code
indust_max = max(indust_share_full$pct_fmv_indust_incent)
figure7B <- indust_share_full |>
  select(clean_name, pct_fmv_indust_incent) |>
  left_join(nicknames)|>
filter(clean_name != "Unincorporated") |>
  full_join(muni_shp, by = c("shpfile_name" = "MUNICIPALITY")) 

figure7B |>
  ggplot(aes(fill = pct_fmv_indust_incent)) +
  geom_sf(aes(geometry = geom), color = "black") +
  theme_void() + 
  theme(axis.ticks = element_blank(), axis.text = element_blank())+
  scale_fill_steps2(
    high = "brown", low = "black",
    show.limits=TRUE,
    nice.breaks=FALSE,
    na.value="gray",
    n =4,
    name = "FMV with\nIncentive Class",
    labels = scales::percent) +
   geom_sf_pattern(data = no_incentives, aes(geometry = geom), pattern = 'crosshatch', pattern_spacing = 0.015, pattern_density = 0.1, fill = "white", alpha = .5, color = 'gray40')+
  ggtitle(label = "Industrial FMV with Incentive Classification")
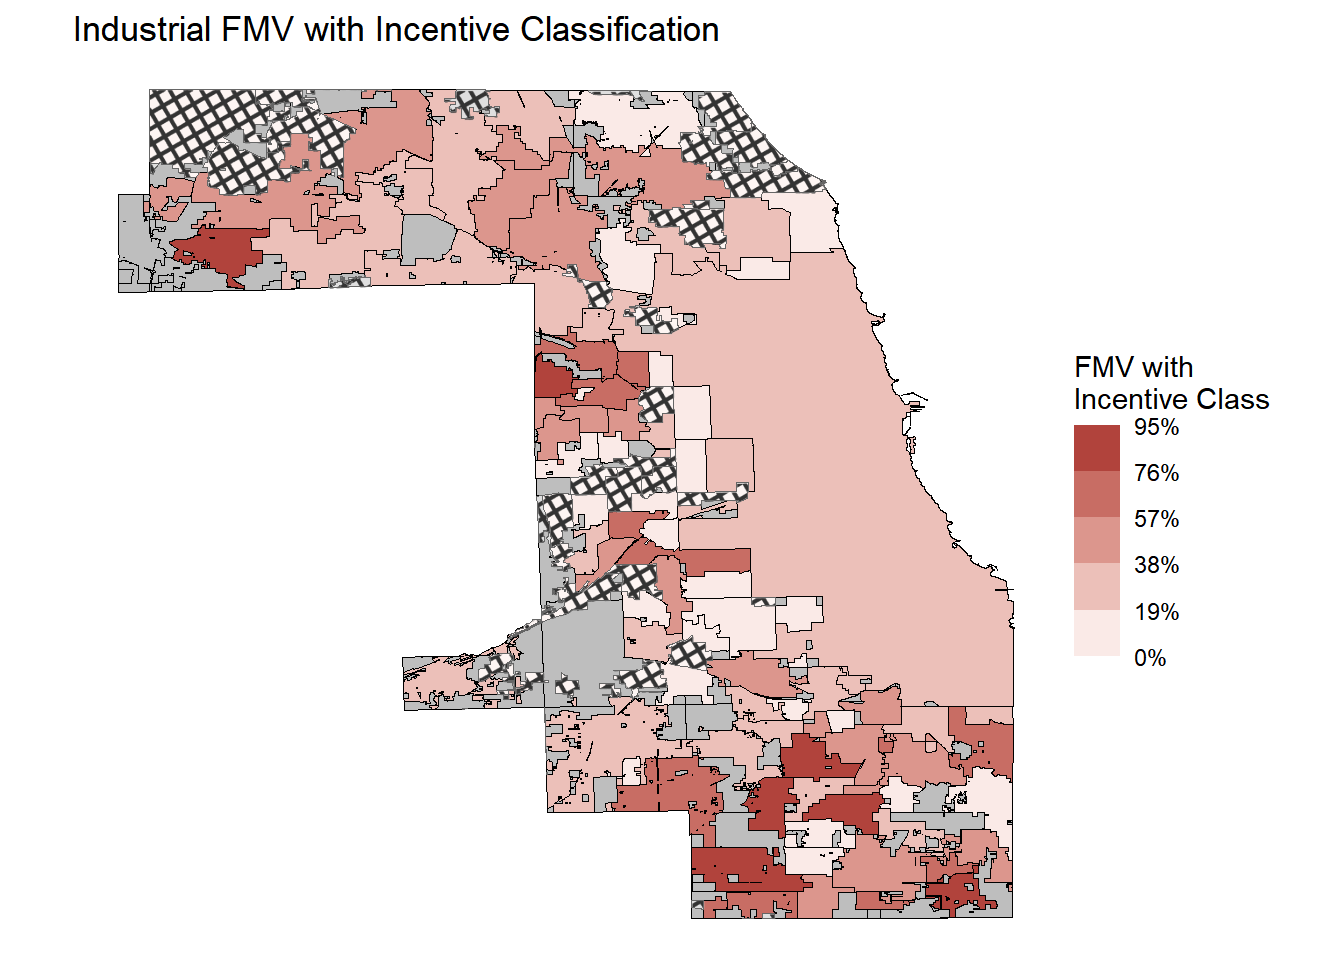
Figure 13.4: Share of Industrial FMV that has an incentive property class.

Share of Commercial FMV with Incentive Classification within each Municipality

Code
commerc_share_full <- muni_sums  |>
  
  filter(year == params$year & !clean_name %in% cross_county_line) |>
  ungroup() |>
  mutate(pct_fmv_commerc_incent =  muni_fmv_commerc_incent/muni_fmv_commercial,
    pct_fmv_commerc_incent = ifelse(is.na(pct_fmv_commerc_incent), 0, pct_fmv_commerc_incent)) |>
  select(clean_name, pct_fmv_commerc_incent) |> 
  arrange(desc(pct_fmv_commerc_incent))

muni_count <- n_distinct(commerc_share_full$clean_name)
no_incents <- n_distinct(commerc_share_full$clean_name[commerc_share_full$pct_fmv_commerc_incent == 0])
median = round(muni_count/2)
median_5 = c( (median-2) : (median+2) )
bottom_5 = c( (muni_count-4) : muni_count )

commerc_share <- commerc_share_full |>
  slice(c(1:5, median_5))  |>
  mutate(pct_fmv_commerc_incent = scales::percent(pct_fmv_commerc_incent, accuracy = 0.01 ) ) 

commerc_share |>
  flextable() |> 
  border_remove() |>
  align(j = 2, align = "right", part = "all") |>
  hline_top() |>
  hline(i = c(5,10)) |>
  set_header_labels(clean_name = "Municipality", pct_fmv_commerc_incent = "% FMV with\nIncent. Class.") |>
  add_footer_lines(top = FALSE, values = paste0("There are ", no_incents, "  municipalities that do not use incentives and have a majority of their taxable EAV within Cook County.") ) |>
  
  bold(i = 8) |>
  set_table_properties( layout = "autofit")

Municipality

% FMV with
Incent. Class.

Sauk Village

47.22%

Posen

30.91%

Calumet Park

30.46%

Ford Heights

30.00%

South Holland

28.67%

Arlington Heights

1.97%

Oak Lawn

1.81%

Countryside

1.74%

Hoffman Estates

1.66%

Chicago Ridge

1.45%

There are 46 municipalities that do not use incentives and have a majority of their taxable EAV within Cook County.

Table 13.14: Percent of Commercial FMV within each Municipality that has incentive classification.
Code
figure7C <- commerc_share_full |>
  select(clean_name, pct_fmv_commerc_incent) |>
  left_join(nicknames)|>
filter(clean_name != "Unincorporated") |>
  full_join(muni_shp, by = c("shpfile_name" = "MUNICIPALITY")) 

figure7C |>
  ggplot(aes(fill = pct_fmv_commerc_incent)) +
  geom_sf(aes(geometry = geom), color = "black") +
  theme_void() + 
  theme(axis.ticks = element_blank(), axis.text = element_blank())+
  scale_fill_steps2(
    high = "brown", low = "black",
    limits = c(0, indust_max),
    show.limits=TRUE,
    nice.breaks=FALSE,
    na.value="gray",
    n =4,
    name = "FMV with\nIncentive Class",
    labels = scales::percent
) +
   geom_sf_pattern(data = no_incentives, aes(geometry = geom), pattern = 'crosshatch', pattern_spacing = 0.015, pattern_density = 0.1, fill = "white", alpha = .5, color = 'gray40')+
  ggtitle(label = "Commercial FMV with Incentive Classification")
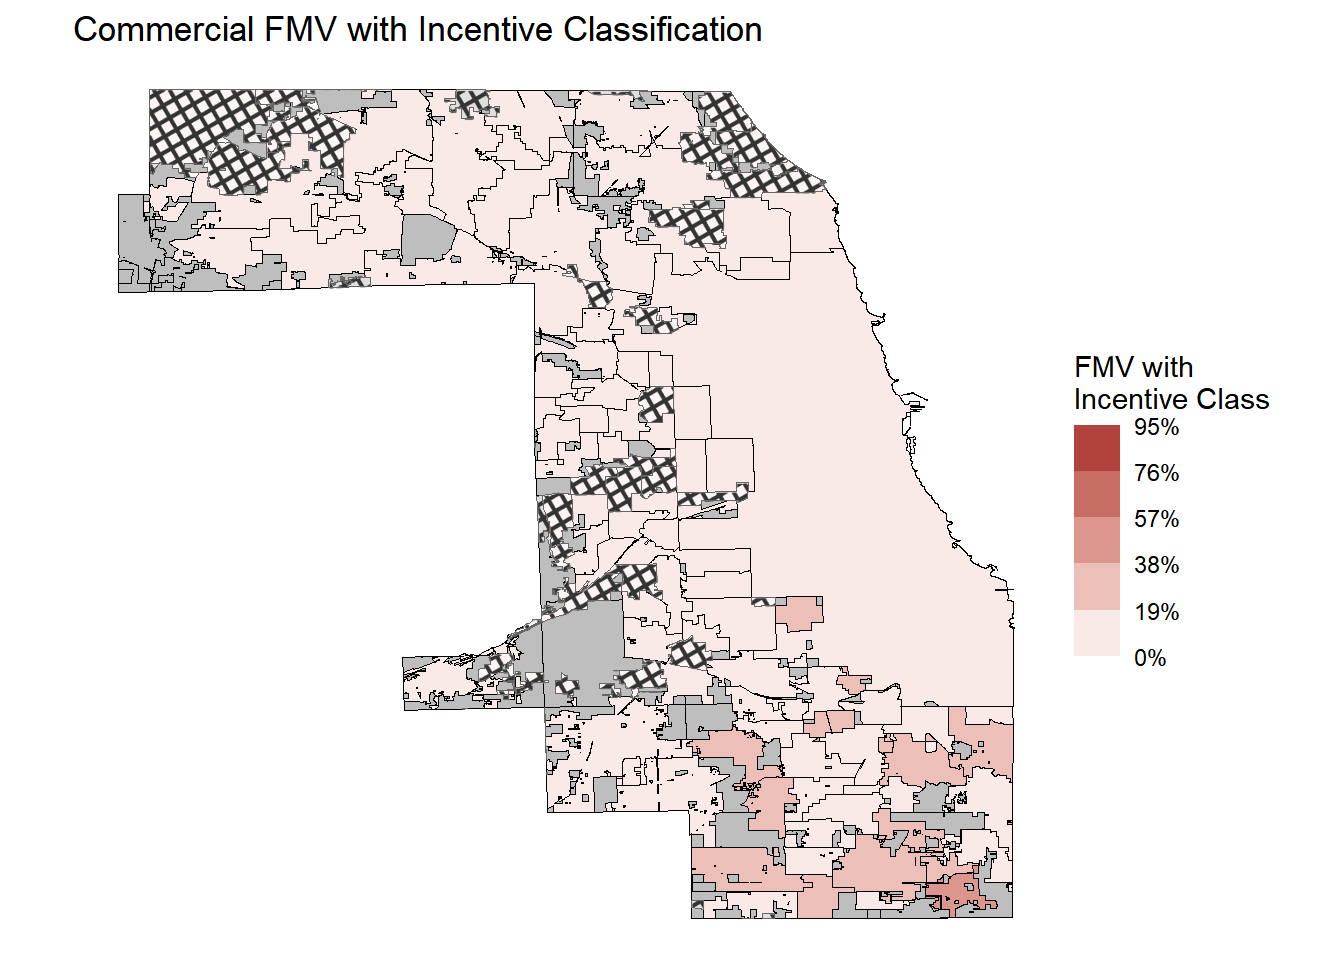
Figure 13.5: Share of Commercial FMV that has an incentive property class.

The Costs of Incentives

Shifted Tax Revenue and Tax Burden

Read in CCAO level of assessment rates for each property class. Read in Summary file for Municipalities from 2006 to 2024.

Code
muni_rate <- read_csv("../Output/ptaxsim_muni_level_2006to2024.csv") |>
  filter(year == params$year) |>
  left_join(nicknames) |> 
  select(clean_name, muni_current_rate_avg, muni_pct_eav_taxed) |>
  rename(cur_munilevel_rate = muni_current_rate_avg) |> 
  filter(!clean_name %in% cross_county_line)

muni_ratechange <- read_csv(paste0("../Output/website_files/muni_ratechange_", params$year, ".csv")) |> 
  filter(!clean_name %in% cross_county_line)

Not Taxed Value - PIN aggregated to County Level

Code
cook_ratechange <- pin_data |>
  filter(!clean_name  %in% cross_county_line) |> 
  summarize(
    
    ## New Tax Base Calculations
    new_TEAV_noIncents = sum(ifelse(class >= 600 & class < 900,
                                    (taxed_av*eq_factor/loa)*0.25, taxed_av*eq_factor), na.rm=TRUE),
    
    ## NewTax Base Calculations
    new_TEAV_noCommercIncents = sum(ifelse(class >= 600 & class < 900 & class %in% commercial_classes,
                                           (taxed_av*eq_factor/loa)*0.25, taxed_av*eq_factor), na.rm=TRUE),

   new_TEAV_noIndustIncents = sum(ifelse(class >= 600 & class < 900 & class %in% industrial_classes,
      (taxed_av*eq_factor/loa)*0.25, taxed_av*eq_factor), na.rm=TRUE),

    new_TEAV_noC6 = sum(ifelse( class >=600 & class < 700, 
(taxed_av*eq_factor/loa)*0.25 , taxed_av*eq_factor), na.rm=TRUE),

    new_TEAV_noC7 = sum(ifelse(class >=700 & class < 800,
(taxed_av*eq_factor/loa)*0.25, taxed_av*eq_factor), na.rm=TRUE),

    new_TEAV_noC8 = sum(ifelse(class >=800 & class < 900, (taxed_av*eq_factor/loa)*0.25, taxed_av*eq_factor), na.rm=TRUE),
    
    new_TEAV_vacant_props = sum(ifelse(class >=600 & class <900,  # if incentive classes were assessed at 0% (aka not taxedat all) or if the building lost its value completely without the incentive classification.
                                       0, taxed_av*eq_factor), na.rm=TRUE),
    
    new_TEAV_noExemps = sum(taxed_av*eq_factor + exe_total_adj, na.rm=TRUE), # does not include abatements
    new_TEAV_noAbates = sum(taxed_av*eq_factor + exe_abate, na.rm=TRUE), # include only abatements, not other exemption types
  
    # TIF increment above the frozen EAV
    forgone_TIF_EAV = sum(fmv_tif_increment * loa * eq_factor, na.rm=TRUE),
 
    cty_PC = n(),
    # projects = n_distinct(both_ids), # mostly for industrial and commercial properties
    pins_withincents = sum(incent_prop == 1),
    fmv_incentive = sum(ifelse(incent_prop == 1, fmv, 0), na.rm = TRUE),
    #fmv_taxed =  sum(taxed_fmv, na.rm=TRUE),
    fmv_incents_inTIFs = sum(ifelse(incent_prop == 1 & final_tax_to_tif > 0, fmv, 0), na.rm = TRUE),
    fmv_inTIF = sum(fmv_inTIF, na.rm=TRUE),
    fmv_tif_increment = sum(fmv_tif_increment, na.rm=TRUE),
 #   fmv_untaxable_value = sum(untaxable_value_fmv , na.rm=TRUE),
    fmv_exemptions = sum(exe_total_adj/eq_factor/loa, na.rm=TRUE),
    fmv_abatements = sum(exe_abate/eq_factor/loa, na.rm=TRUE),
    zero_bill = sum(zero_bill, na.rm=TRUE),
    fmv_residential = sum(ifelse(res_prop==1, fmv, 0), na.rm = TRUE),
    fmv_C2 = sum(ifelse(c2_prop == 1, fmv, 0), na.rm = TRUE),
    
    fmv_industrial = sum(ifelse(class %in% industrial_classes, fmv, 0), na.rm = TRUE),
    fmv_commercial = sum(ifelse(class %in% commercial_classes, fmv, 0), na.rm = TRUE),
    
    current_rate_avg = mean(tax_code_rate),
    avg_C2_bill_noexe = mean(ifelse(between(class,200,299) & exe_total_adj == 0, (final_tax_to_dist + final_tax_to_tif), NA), na.rm=TRUE),
    avg_C2_bill_withexe = mean(ifelse(between(class,200,299) & exe_total_adj > 0, (final_tax_to_dist + final_tax_to_tif), NA), na.rm=TRUE),
    av_taxed = sum(taxed_av, na.rm = TRUE),
    untaxable_value_av = sum(untaxable_value_av, na.rm=TRUE),
    av = sum(av),
    eav_taxed = sum(taxed_av*eq_factor), 
    eav_untaxable = sum(untaxable_value_eav, na.rm=TRUE),
    fmv = sum(fmv, na.rm=TRUE),
    pins_in_class = n(),
    exe_total_adj = sum(exe_total_adj),   # in EAV
    abatements = sum(exe_abate),            # in EAV
    eav_incents_inTIFs = sum(ifelse(incent_prop == 1 & in_tif == 1, taxed_eav, 0), na.rm = TRUE),

    final_tax_to_dist = sum(final_tax_to_dist), ## Amount of Total Levy
    final_tax_to_tif = sum(final_tax_to_tif),
    eq_av = sum(eq_av)) |>
  mutate(
   reducedEAV_comind_incents =  new_TEAV_noIncents - eav_taxed,
   reducedEAV_commerc_incents  = new_TEAV_noCommercIncents - eav_taxed,

   reducedEAV_indust_incents  = new_TEAV_noIndustIncents - eav_taxed,
    # Absolute maximum TEAV: No Exemptions, no abatements, no TIFS, no Incentive properties
    # Commercial and industrial assessed at 25%
    TEAV_max = eav_taxed + exe_total_adj + abatements + forgone_TIF_EAV +    reducedEAV_comind_incents,

    # no exemptions or incentive classifications:
    TEAV_neither = eav_taxed + exe_total_adj + reducedEAV_comind_incents,

    rate_noExe = final_tax_to_dist / new_TEAV_noExemps,
    rate_noCommercInc = final_tax_to_dist / new_TEAV_noCommercIncents,
    rate_noIndustInc = final_tax_to_dist / new_TEAV_noIndustIncents,

    rate_noAbate = final_tax_to_dist / new_TEAV_noAbates,
    rate_noInc = final_tax_to_dist / new_TEAV_noIncents ,
    rate_neither = final_tax_to_dist / TEAV_neither, 
    rate_noTIFs = final_tax_to_dist / (eav_taxed + forgone_TIF_EAV),
    rate_vacant = final_tax_to_dist / new_TEAV_vacant_props,
    rate_lowest = final_tax_to_dist / TEAV_max ,
    rate_current = final_tax_to_dist / eav_taxed,
    change_noInc = rate_current - rate_noInc,

    forgonerev_noExe = rate_noExe * exe_total_adj,
    forgonerev_noAbate = rate_noAbate * (new_TEAV_noAbates - eav_taxed),
    forgonerev_noIncents = rate_noInc * (new_TEAV_noIncents - eav_taxed),
    forgonerev_noCommercIncents = rate_noInc * (new_TEAV_noCommercIncents - eav_taxed),

    forgonerev_noIndustIncents = rate_noInc* (new_TEAV_noIndustIncents - eav_taxed),

    forgone_noExe_or_Inc = rate_neither * (TEAV_neither - eav_taxed),
    forgonerev_noTIFs = rate_noTIFs * forgone_TIF_EAV,
    forgonerev_vacant = rate_vacant * (new_TEAV_vacant_props - eav_taxed),
    forgonerev_maxTEAV = rate_lowest * (TEAV_max - eav_taxed)
)

cook_ratechange |>
 mutate(across(contains("rate"), scales::percent, accuracy = .01),
        change_noInc = round(change_noInc*100, digits = 2)) |>

select("Current Composite Rate" = rate_current, 
       "Rate if Incentive Props LoA is 25%" = rate_noInc, 
       "Tax Rate Change" =  change_noInc) |> 

  flextable()
Current Composite Rate

Rate if Incentive Props LoA is 25%

Tax Rate Change

8.20%

8.02%

0.19

Code
cook_ratechange |> 
select("Commerc. EAV w/Incent" = reducedEAV_commerc_incents, 
       "Indust EAV w/ Incent" = reducedEAV_indust_incents,
       "CommInd EAV w/ Incent" = reducedEAV_comind_incents,
       "Homeowner Exemption Exempt EAV" = exe_total_adj) |> 
  flextable()

Commerc. EAV w/Incent

Indust EAV w/ Incent

CommInd EAV w/ Incent

Homeowner Exemption Exempt EAV

1,081,216,392

3,658,169,347

4,739,385,739

16,722,709,858

Table 13.15: Change in taxable EAV due to Incentive Classification

$15 Billion EAV is tax exempt due to homeowners exemptions. All incentive properties combined only have $4 billion EAV that is tax exempt (due to the decreased level of assessment which results in less AV, and therefore, EAV)

Estimates for Revenue Shifted to Non-Incentive Class Properties

Take new tax rate and apply it to new taxbase.

Code
table7 <- cook_ratechange |> 
  select(contains("forgonerev") ) 

table7 |> 
  flextable()

forgonerev_noExe

forgonerev_noAbate

forgonerev_noIncents

forgonerev_noCommercIncents

forgonerev_noIndustIncents

forgonerev_noTIFs

forgonerev_vacant

forgonerev_maxTEAV

1,268,500,835

0

380,034,456

86,698,890

293,335,566

2,012,962,665

-266,863,549

3,262,542,725

Naive Revenue Shift

Uses old current tax rate and multiplies it by the new taxbase.

Code
burden_shift <- pin_data |>
  filter(!agency_num %in% cross_county_lines & 
           !is.na(clean_name) & clean_name!="Unincorporated" )  |>
  summarize(
    # for homestead exemptions
    mostnaive_forgone_tax_amt_exe = sum(tax_amt_exe),    
  
    # more accurate but still uses current tax rate instead of recalculated tax rate:
    forgonerev_from_exemptions  = sum(ifelse(class >= 200 & class < 300,
          (((av*eq_factor) - (taxed_av*eq_factor))) * tax_code_rate, 0), na.rm=TRUE),

   # amount of EAV from taxing an additional 15% of the AV if incentive properties didn't exist
   # using current tax rate for each property at the tax code level
    forgonerev_from_comind_incents  = sum(ifelse(class >= 600 & class < 900,
          (((taxed_av*eq_factor)*0.25 - (taxed_av*eq_factor))) * tax_code_rate, 0), na.rm=TRUE),

    forgonerev_commerc_incents  = sum(ifelse(class >= 600 & class < 900 & class %in% commercial_classes,
          (((taxed_av*eq_factor)*0.25 - (taxed_av*eq_factor))) * tax_code_rate, 0), na.rm=TRUE),

    forgonerev_indust_incents  = sum(ifelse(class >= 600 & class < 900 & class %in% industrial_classes,
         (((taxed_av*eq_factor)*0.25 - (taxed_av*eq_factor))) * tax_code_rate, 0), na.rm=TRUE),
   
    #  forgonerev_noTIFs = rate_current/100 * ,
       # TIF increment above the frozen EAV
    forgonerev_TIFs = sum(fmv_tif_increment * loa * eq_factor*tax_code_rate, na.rm=TRUE),
   
   # if incentive properties had no tax value (i.e. owners left, or fully tax exempt)
   # also equal to the current amount collected from incentive properties
     forgonerev_vacant = sum(ifelse(class >= 600 & class < 900,  taxed_av*eq_factor * tax_code_rate, 0), na.rm = TRUE)
   )|>
  rename(
    `Naive Est. Homeowner Exemptions` = mostnaive_forgone_tax_amt_exe,

    `Homeowner Exemptions` = forgonerev_from_exemptions,
    `C&I Incentives` = forgonerev_from_comind_incents,
    `Commercial Incentive`= forgonerev_commerc_incents,
    `Industrial Incentive` = forgonerev_indust_incents,
    `TIFs` = forgonerev_TIFs,
    `Incent Props become Vacant` = forgonerev_vacant
  ) 

burden_shift |> flextable()

Naive Est. Homeowner Exemptions

Homeowner Exemptions

C&I Incentives

Commercial Incentive

Industrial Incentive

TIFs

Incent Props become Vacant

1,520,237,369

2,068,748,072

-245,085,882

-51,047,047

-194,038,835

2,065,107,660

326,781,176

Change in Composite Property Tax Rate Due to Incentives and other Policy Scenarios

Tables - Difference in Composite Tax Rates

Code
muni_ratechange_full <- muni_ratechange |> 
  select(clean_name, rate_current, rate_noExe, change_noExe) |> 
  arrange(desc(change_noExe) )


muni_count <- n_distinct(muni_ratechange_full$clean_name)
no_incents <- n_distinct(muni_ratechange_full$clean_name[muni_ratechange_full$change_noExe < 0.0001])
median = round(muni_count/2)
median_5 = c( (median-2) : (median+2) )
bottom_5 = c( (muni_count-4) : muni_count )

table1JD_full <- muni_ratechange_full

table1JD <- muni_ratechange_full |>
  slice(c(1:5, median_5, bottom_5)) 

table1JD  |>
  mutate(across(is.numeric, scales::percent, accuracy = 0.01) ) |>
  flextable() |> 
  border_remove() |>
  hline_top() |>
  hline(i = c(5,10,15)) |>
  set_header_labels(clean_name = "Municipality", rate_current = "Current Comp.\nTax Rate", rate_noExe = "Tax Rate if No\ Exemptions",
                    change_noExe = "Rate Change") |>
  bold(i = 8) |>
  set_table_properties( layout = "autofit") |>
    align(j = 2:4, align = "right", part = c("all"))

Municipality

Current Comp.
Tax Rate

Tax Rate if No Exemptions

Rate Change

Phoenix

34.08%

13.85%

20.23%

Park Forest

25.36%

18.29%

7.08%

Riverdale

27.34%

21.29%

6.05%

Calumet City

23.32%

18.17%

5.15%

Dolton

21.11%

16.02%

5.08%

Crestwood

9.31%

8.10%

1.20%

Prospect Heights

10.78%

9.58%

1.20%

Chicago Ridge

10.92%

9.84%

1.08%

Orland Hills

9.00%

7.95%

1.05%

Riverside

10.97%

9.92%

1.05%

Winnetka

7.94%

7.75%

0.19%

Rosemont

9.20%

9.10%

0.10%

Hodgkins

9.10%

9.03%

0.07%

Mc Cook

10.76%

10.69%

0.07%

Bedford Park

11.96%

11.90%

0.06%

Table 13.16: Composite Tax Rate Change from hypothetical scenario of taxing property that is current exempt due to exemptions.
Code
muni_ratechange_full <- muni_ratechange |> 
  select(clean_name, rate_current, rate_noInc, change_noInc) |> 
  arrange(desc(change_noInc) )


muni_count <- n_distinct(muni_ratechange_full$clean_name)
no_incents <- n_distinct(muni_ratechange_full$clean_name[muni_ratechange_full$change_noInc < 0.0001])
median = round(muni_count/2)
median_5 = c( (median-2) : (median+2) )
bottom_5 = c( (muni_count-4) : muni_count )

table3JD_full <- muni_ratechange_full
table3JD <- muni_ratechange_full|>
  slice(c(1:5, median_5)) 

table8 <- muni_ratechange_full|>
  slice(c(1:5, median_5)) 

table8  |>
  mutate(across(is.numeric, scales::percent, accuracy = 0.01) ) |>
  flextable() |> 
  border_remove() |>
  hline_top() |>
  hline(i = c(5,10)) |>
  set_header_labels(clean_name = "Municipality", rate_current = "Current Comp.\nTax Rate", rate_noInc = "Tax Rate if No\nIncent. Class.",
                    change_noInc = "Rate Change") |>
  bold(i = 8) |>
  add_footer_lines(paste0("There are ", no_incents,  " municipalities that do not use incentives and have a majority of their taxable EAV within Cook County."), top = FALSE) |>
  set_table_properties( layout = "autofit") |>
    align(j = 2:4, align = "right", part = c("all"))

Municipality

Current Comp.
Tax Rate

Tax Rate if No
Incent. Class.

Rate Change

Phoenix

34.08%

24.15%

9.93%

Ford Heights

25.70%

21.46%

4.24%

North Lake

11.23%

7.64%

3.60%

Bedford Park

11.96%

8.42%

3.54%

Matteson

14.37%

11.34%

3.03%

Robbins

12.86%

12.67%

0.20%

Tinley Park

10.29%

10.09%

0.20%

Schaumburg

9.59%

9.40%

0.19%

Chicago Ridge

10.92%

10.74%

0.18%

Glenview

7.67%

7.49%

0.18%

There are 29 municipalities that do not use incentives and have a majority of their taxable EAV within Cook County.

Table 13.17: Composite Tax Rate Change from hypothetical scenario of taxing incentive property at 25% of their FMV instead of 10% of their FMV.
Code
muni_ratechange |> 
  select(clean_name, change_noInc) |> 
 mutate(change_noInc = round(change_noInc*100, digits = 1)) |>
  filter(clean_name != "Unincorporated") |>
  left_join(nicknames) |>
  full_join(muni_shp, by = c("agency_name" = "AGENCY_DESC")) |>
  ggplot(aes(fill = change_noInc)) +
  geom_sf(aes(geometry = geom), color = "black") +
  theme_void() + 
  theme(axis.ticks = element_blank(), axis.text = element_blank())+
  scale_fill_steps2(
    low = "lightblue", high = "#1e478e",
    show.limits=TRUE,
    nice.breaks=FALSE,
    na.value = "gray50",
    n =4,
    name = "Tax Rate Change\nin Percentage Pts") +
  
   geom_sf_pattern(data = no_incentives, aes(geometry = geom), pattern = 'crosshatch', pattern_spacing = 0.015, pattern_density = 0.1, fill = "white", alpha = .5, color = 'gray40')
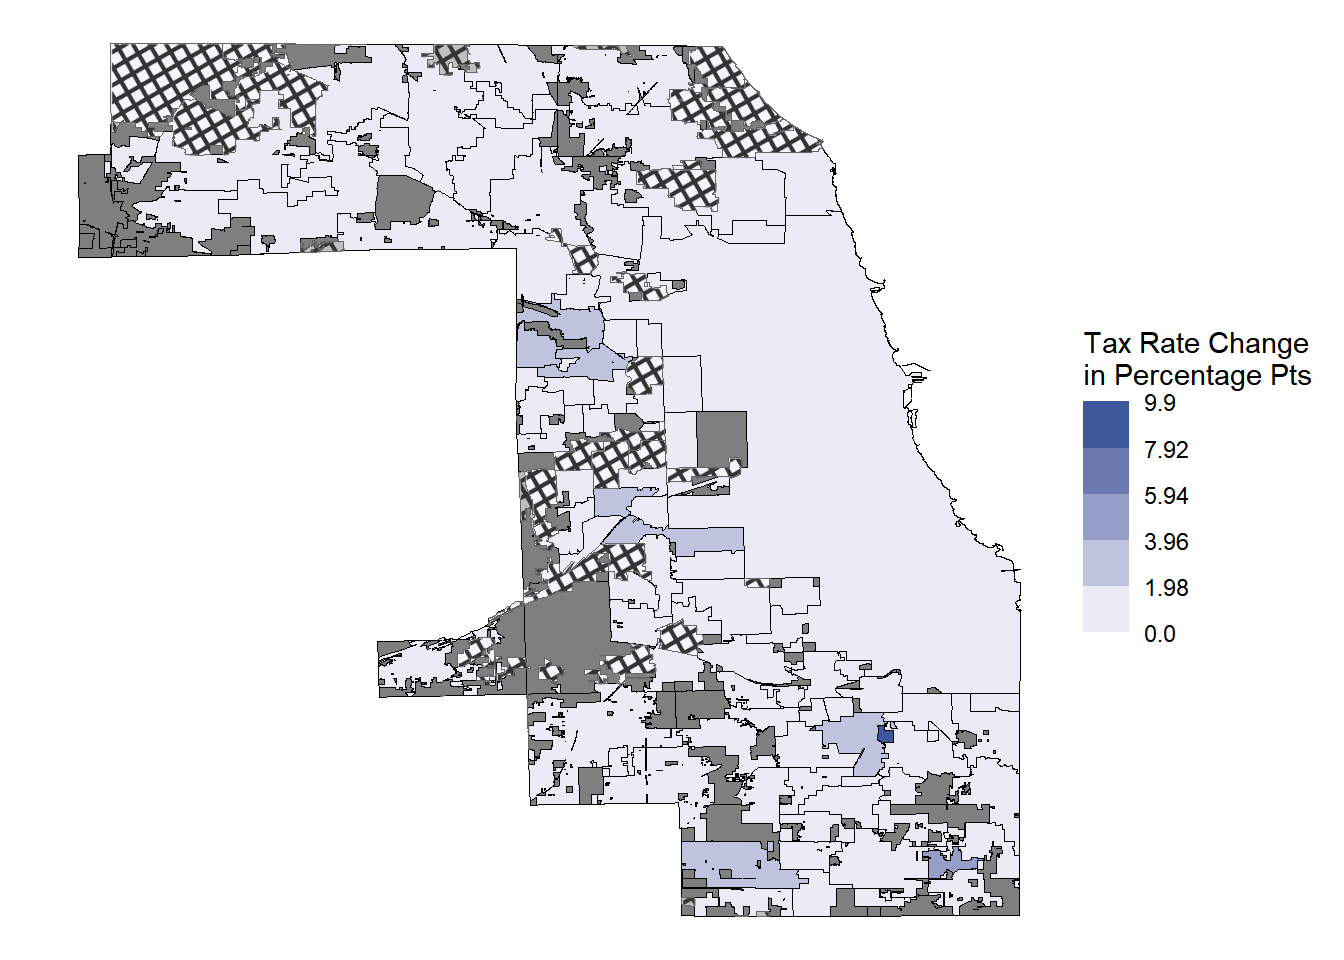
Figure 13.6: Hypothetical change in composite tax rate if all value that currently receives incentive classification became assessed at 25%.
Code
muni_ratechange_full <- muni_ratechange |> 
  mutate(change_vacant=rate_vacant-rate_current)|>
  select(clean_name, rate_current, rate_vacant, change_vacant) |> 
  arrange(desc(change_vacant))


muni_count <- n_distinct(muni_ratechange_full$clean_name)
no_incents <- n_distinct(muni_ratechange_full$clean_name[abs(muni_ratechange_full$change_vacant) < 0.0001])
median = round(muni_count/2)
median_5 = c( (median-2) : (median+2) )
bottom_5 = c( (muni_count-4) : muni_count )

table9 <- muni_ratechange_full|>
  slice(c(1:5, median_5)) 

table9  |>
  mutate(across(is.numeric, scales::percent, accuracy = 0.01) ) |>
  flextable() |> 
  border_remove() |>
  hline_top() |>
  hline(i = c(5,10)) |>
  set_header_labels(clean_name = "Municipality", rate_current = "Current Comp.\nTax Rate", rate_vacant = "Tax Rate if No\nIncent. Class.",
                    change_vacant = "Rate Change") |>
  bold(i = 8) |>
  add_footer_lines(paste0("There are ", no_incents,  " municipalities that do not use incentives and have a majority of their taxable EAV within Cook County."), top = FALSE) |>
  set_table_properties( layout = "autofit") |>
    align(j = 2:4, align = "right", part = c("all"))

Municipality

Current Comp.
Tax Rate

Tax Rate if No
Incent. Class.

Rate Change

Phoenix

34.08%

46.96%

12.88%

North Lake

11.23%

16.38%

5.15%

Ford Heights

25.70%

30.63%

4.93%

Bedford Park

11.96%

16.61%

4.65%

Matteson

14.37%

17.55%

3.18%

Midlothian

13.06%

13.20%

0.14%

Robbins

12.86%

13.00%

0.14%

Palatine

10.29%

10.43%

0.14%

Tinley Park

10.29%

10.43%

0.14%

Chicago Ridge

10.92%

11.05%

0.13%

There are 32 municipalities that do not use incentives and have a majority of their taxable EAV within Cook County.

Table 13.18: Composite Tax Rate Change Maximum increase in composite property tax rate due to incentives. (five largest and five median). Scenario from if properties that currently receive incentives lost all their value (i.e. most extreme scenario for if we didn’t have incentives and nobody used the land so it had no value.)
Code
# as a dot graph ## 
# create order of dots
order <- muni_ratechange |>  
  as_tibble() |> 
  filter(change_noInc > 0) |> 
  arrange(change_noInc) |>
  select(clean_name, change_noInc) |>
  distinct()


# make dot graph
muni_ratechange |> 
  filter(change_noInc > .005) |>
  filter(change_noInc > 0) |>

  select(clean_name, rate_current, rate_noInc, change_noInc) |> 
  distinct() |>
  pivot_longer(c("rate_current", "rate_noInc"), 
               names_to = "type", values_to = "tax_rate") |> 
  left_join(order) |>
    filter(change_noInc > 0 ) |>
  mutate(clean_name = if_else(clean_name == "Mc Cook", "McCook", clean_name)) |>
  ggplot(aes(x = tax_rate, y= reorder(clean_name, change_noInc)))+
  geom_line(aes(group = clean_name))+ 
  geom_point(aes(fill=type), size=3, pch = 21, color = "black" )+
  theme_minimal() + 
  theme( 
    legend.title = element_blank(),
    plot.title.position = "plot",
    plot.background = element_rect(fill='transparent', color=NA) #transparent plot bg
  )+
  scale_fill_brewer(palette="Paired", labels = c("Incentives", "No Incentives"), direction = 1) +
  labs(title = "Difference in Composite Tax Rate if Assessed at 25%",
       subtitle = "Ordered by Comp. Rate Change", x = "Composite Tax Rate (%)", y = "")
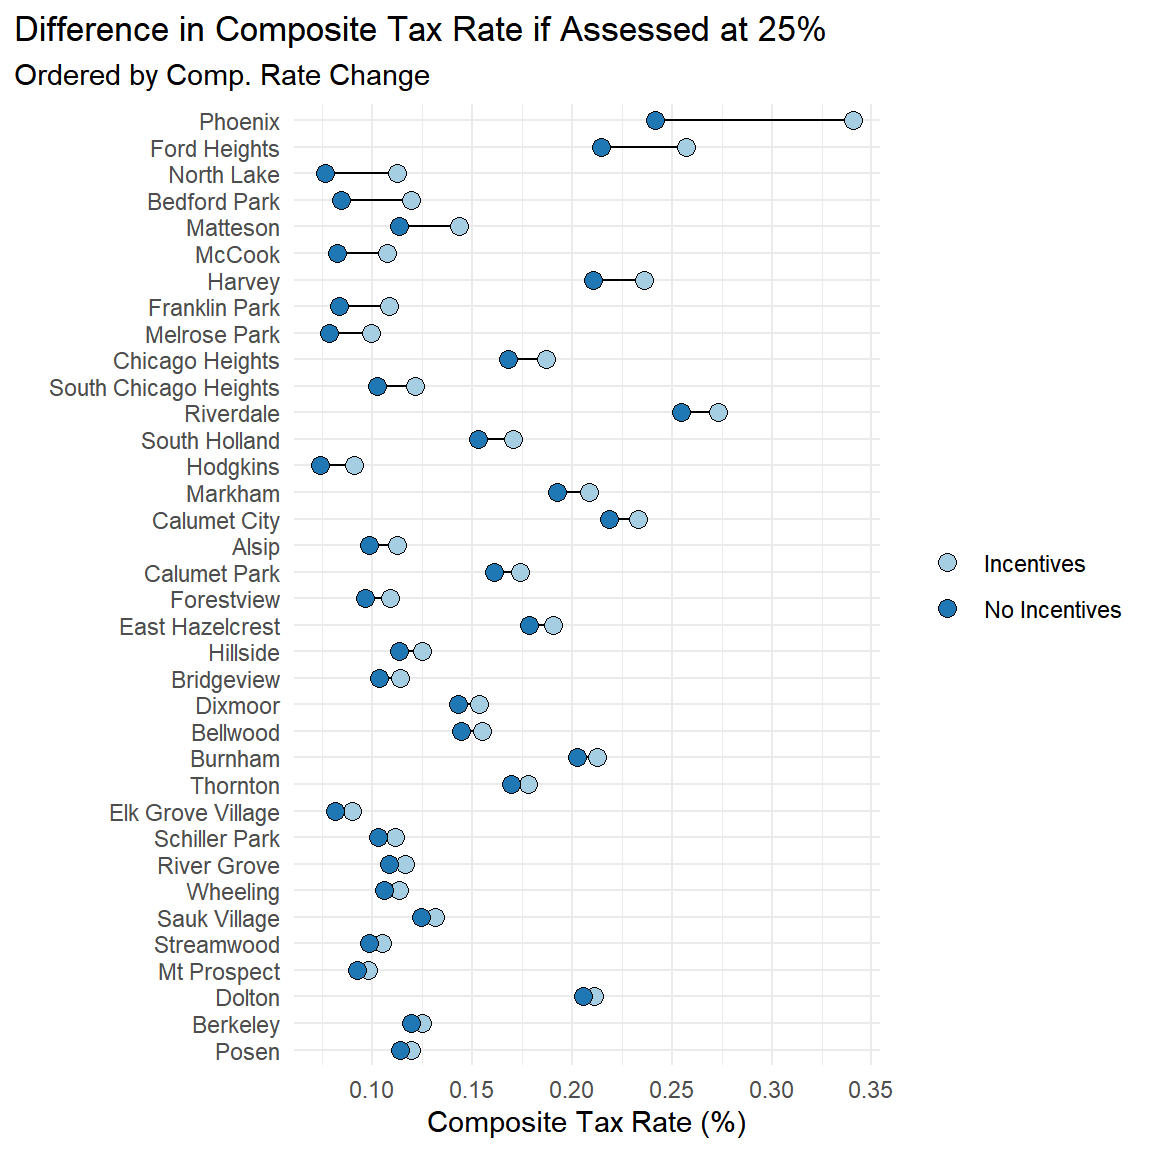
Figure 13.7: Ordered by amount of change in the composite tax rate.
Code
# as a dot graph ## 
# create order of dots
order <- muni_ratechange |>  
  as_tibble() |> 
 filter(change_noInc >0) |>
  arrange(rate_current) |>
  select(clean_name, rate_current)

# make dot graph
muni_ratechange |> 
 filter(change_noInc > .005) |>
  select(clean_name, rate_current, rate_noInc) |> 
  distinct() |>
  arrange(rate_current) |>
  pivot_longer(c("rate_current", "rate_noInc"), 
               names_to = "type", values_to = "tax_rate") |> 
  inner_join(order) |>
  ggplot(aes(x = tax_rate, y= reorder(clean_name, rate_current)))+
  geom_line(aes(group = clean_name))+ 
  geom_point(aes(fill=type), size=3, pch = 21, color = "black" 
             )+
  theme_minimal() + 
  theme( 
    legend.title = element_blank(),
    plot.title.position = "plot",
    plot.background = element_rect(fill='transparent', color=NA) #transparent plot bg
  )+
  scale_x_continuous(labels = scales::percent)+
  scale_fill_brewer(palette="Paired", labels = c("Incentives", "No Incentives"), direction = 1)+

  
  labs(title = "Difference in Composite Tax Rate if Assessed at 25%",
       subtitle = "Ordered by Current Composite Tax Rate", x = "Composite Tax Rate (%)", y = "")
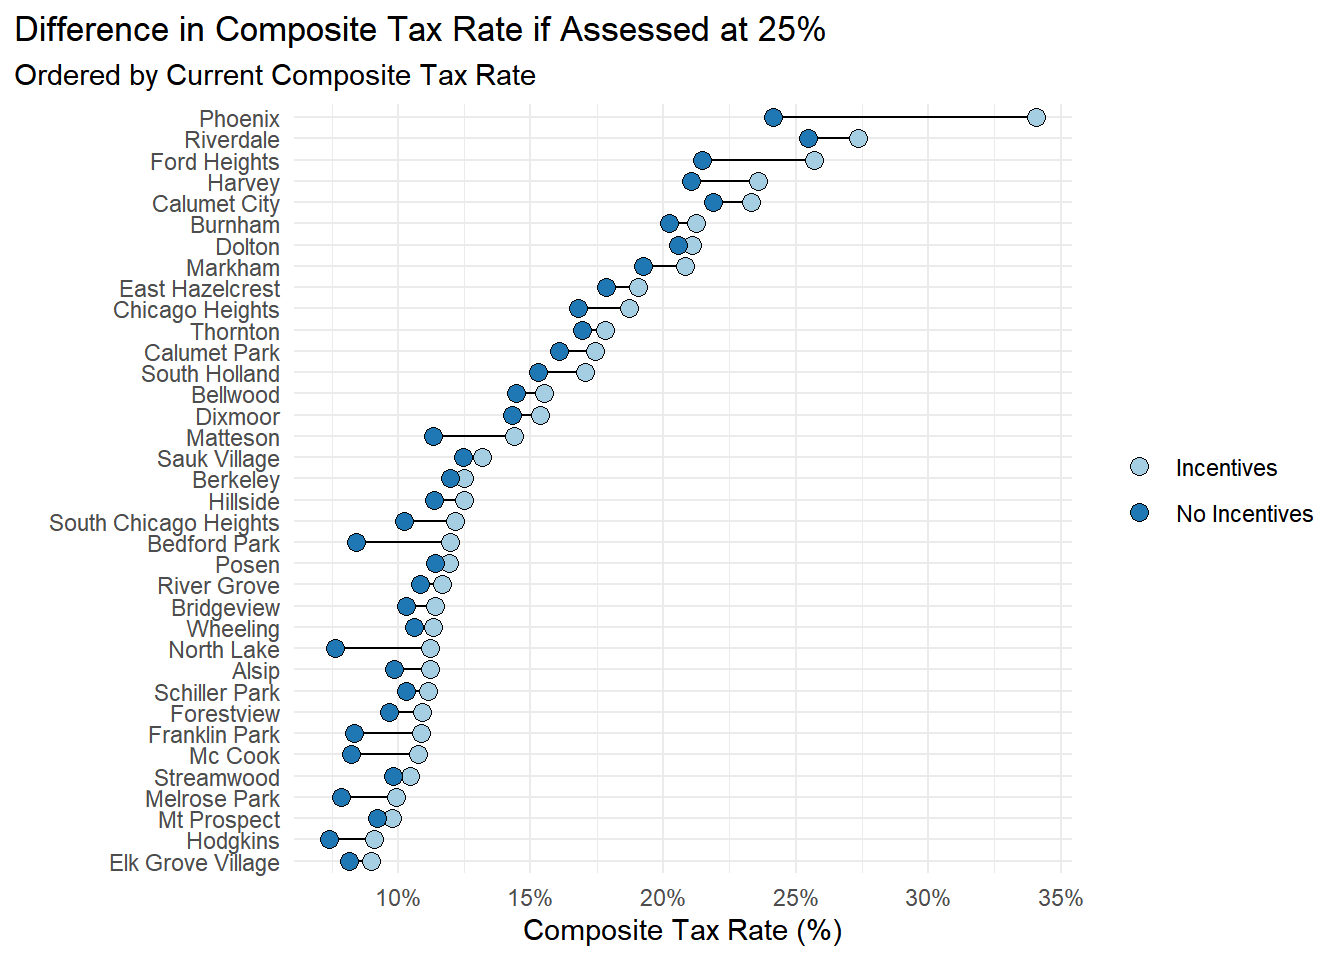
Figure 13.8: Change in tax rate if incentive properties were assessed at 25% of their FMV instead of their reduced level of assessment. Only shows municipalities that had more than 1/2 percentage point change in tax rate.
Code
# as a dot graph ## 
# create order of dots
order <- muni_ratechange |>  
  as_tibble() |> 
  filter(change_noInc > 0) |>
  arrange(rate_current) |>
  select(clean_name, rate_current) |> distinct()

# make dot graph
muni_ratechange |> 
  filter(change_noInc > 0) |>
  select(clean_name, rate_current, rate_noInc, #rate_neither, 
         rate_vacant, rate_noExe) |> 
  distinct() |>
  arrange(rate_current) |>
  pivot_longer(c("rate_current", 
                 "rate_noInc", 
                 "rate_vacant", 
                 "rate_noExe"# ,
                #  "rate_neither"
), 
               names_to = "type", values_to = "tax_rate") |> 
  inner_join(order) |>
  ggplot(aes(x = tax_rate, y= reorder(clean_name, rate_current)))+
  geom_line(aes(group = clean_name))+ 
  geom_point(aes(fill=type), size=3, pch = 21, color = "black" )+
  theme_minimal() + 
  theme( 
    legend.title = element_blank(),
legend.position = "bottom",
plot.title.position = "plot",
    plot.background = element_rect(fill='transparent', color=NA) #transparent plot bg
  )+
  scale_fill_brewer(palette = "RdGy",
                    labels = c("Current Rate", 
                             #  "No Exemps & LoA is 25%",
                               "No Exemptions", 
                               "No Incentives:\nLoA 25%",
                               "Incententive Classification\nLoA = 0%"
                    ), 
                    direction = -1) +
    scale_x_continuous(labels = scales::percent)+

  labs(title = "Composite Tax Rate Scenarios",
       subtitle = "Ordered by Current Composite Tax Rate", 
       x = "Composite Tax Rate (%)", y = "")
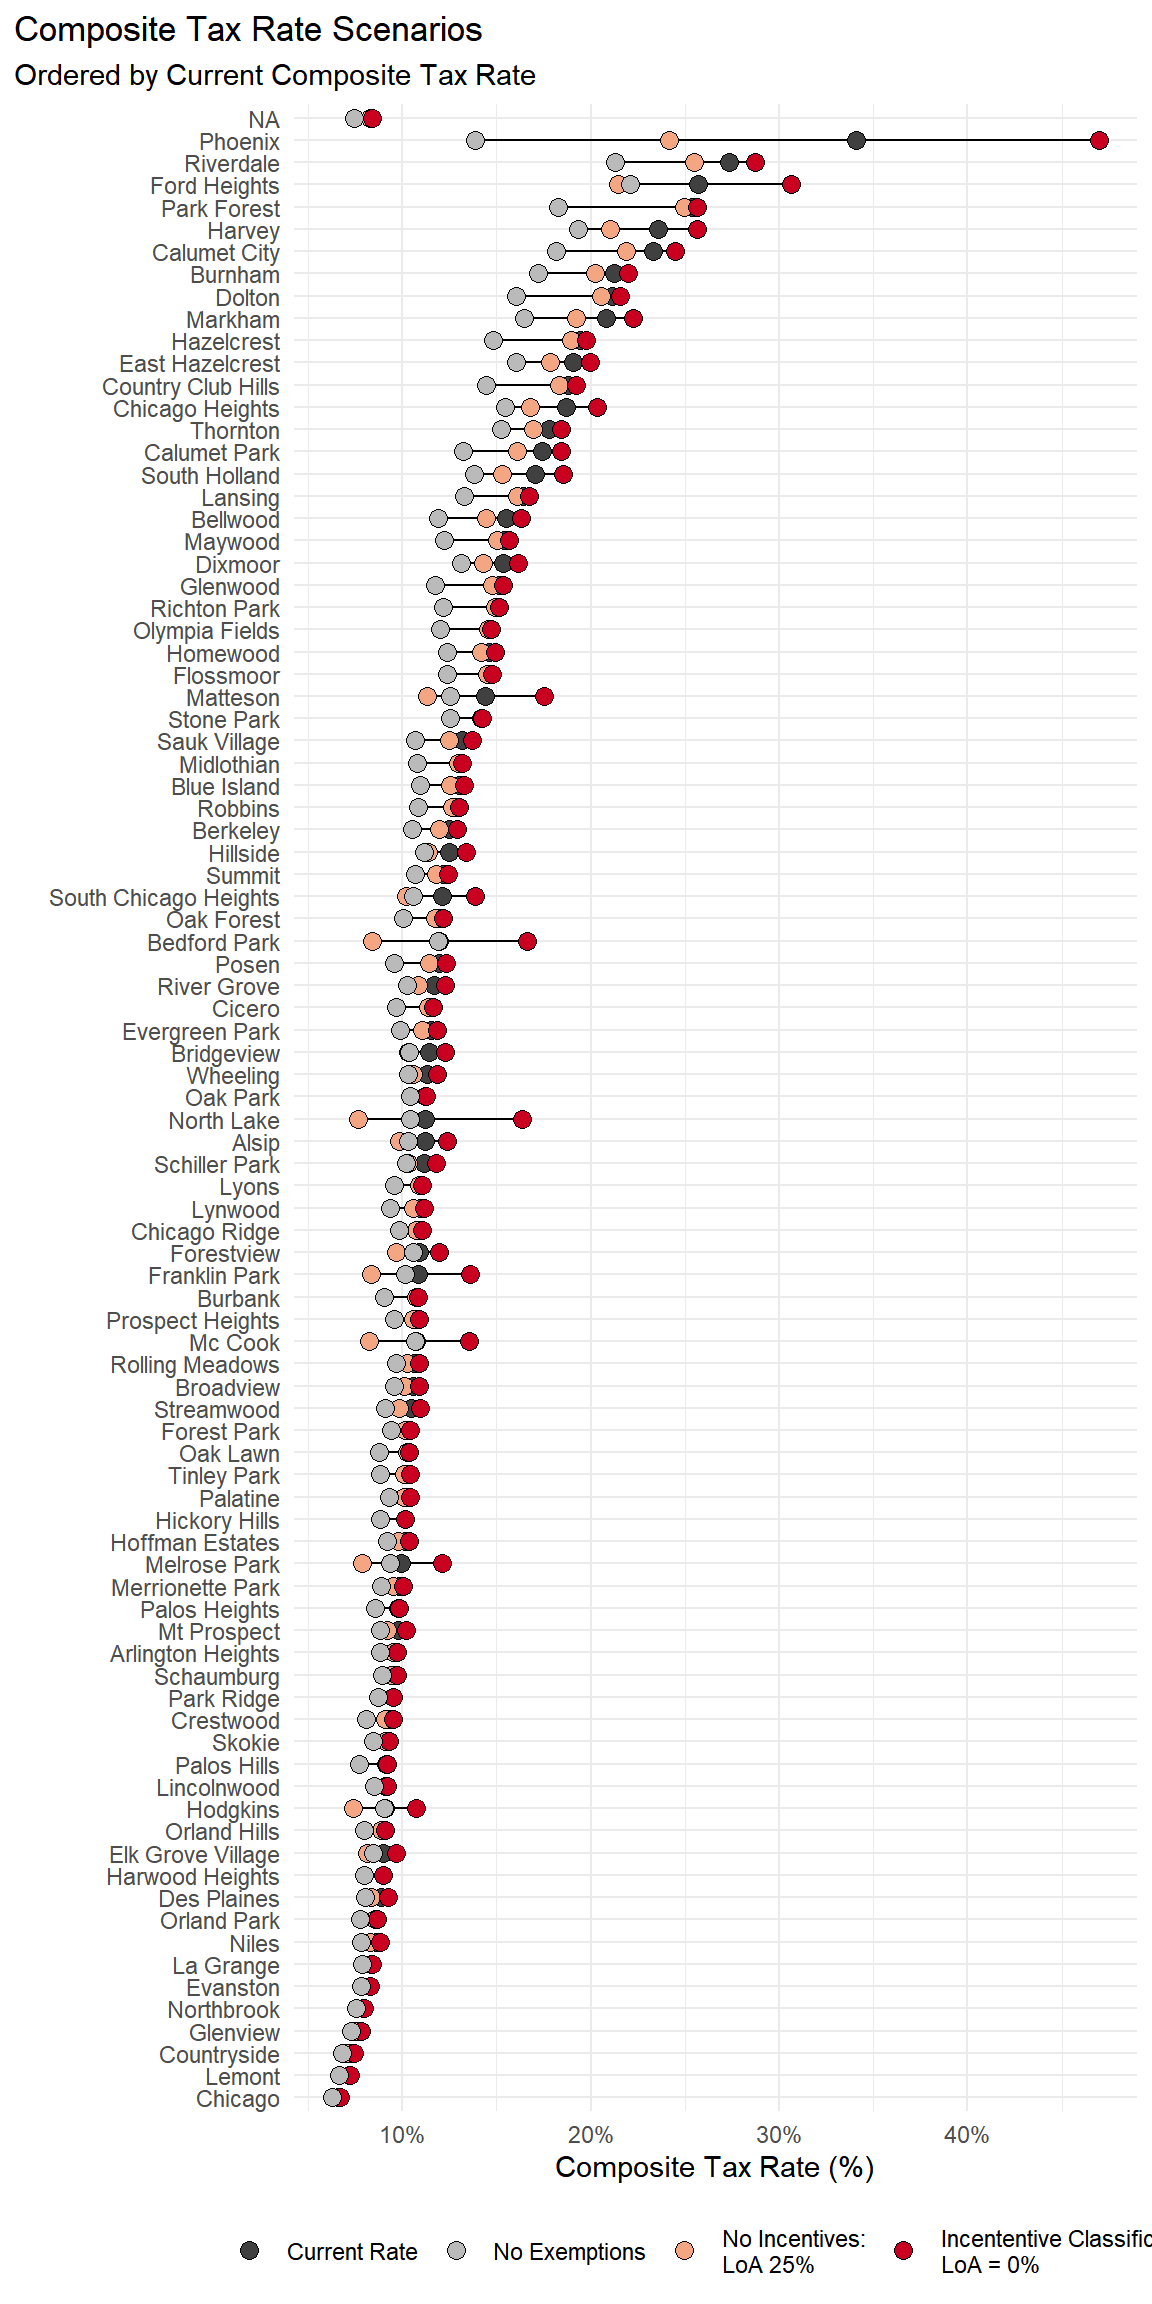
Figure 13.9: Multiple taxrate scenarios. All municipalities that had a taxrate change from altering the level of assessment for incentive class properties.
Code
# as a dot graph ## 
# create order of dots
order <- muni_ratechange |>  
  as_tibble() |> 
  filter(change_noInc > .005 | clean_name == "Chicago") |>
  arrange(rate_current) |>
  select(clean_name, rate_current) |> distinct()

# make dot graph
figure9_data <- muni_ratechange |> 
  filter(change_noInc > .005) |>
  select(clean_name, rate_current, rate_noInc, rate_vacant) |> 
  distinct() |>
  arrange(rate_current) |>
  pivot_longer(c("rate_current", 
                 "rate_noInc", 
                 "rate_vacant"
  ), 
  names_to = "type", values_to = "tax_rate") |> 
  inner_join(order) 

figure9_data|>
  ggplot(aes(x = tax_rate, y= reorder(clean_name, rate_current)))+
  geom_line(aes(group = clean_name))+ 
  geom_point(aes(fill=type), size=3, pch = 21, color = "black" )+
  theme_minimal() + 
  theme( 
    legend.title = element_blank(),
#    legend.position = "bottom",
    legend.position = "none",

    plot.title.position = "plot",
    plot.background = element_rect(fill='transparent', color=NA), #transparent plot bg

      axis.text.y = element_markdown(size = 9) # enable HTML styling in axis labels

)+
  scale_fill_manual(values = c("#ade0ee", "#1e478e", "#6dae4f"),
                    labels = c("Current Rate", 
                               "No Incentive Classes: \nLoA = 25%",
                               "Incentive Classification\nLoA = 0%") ) +  

    scale_x_continuous(labels = scales::percent) +
  labs(#title = "Composite Tax Rate Scenarios",
       #subtitle = "Ordered by Current Composite Tax Rate", 
       x = "Composite Tax Rate (%)", y = "")
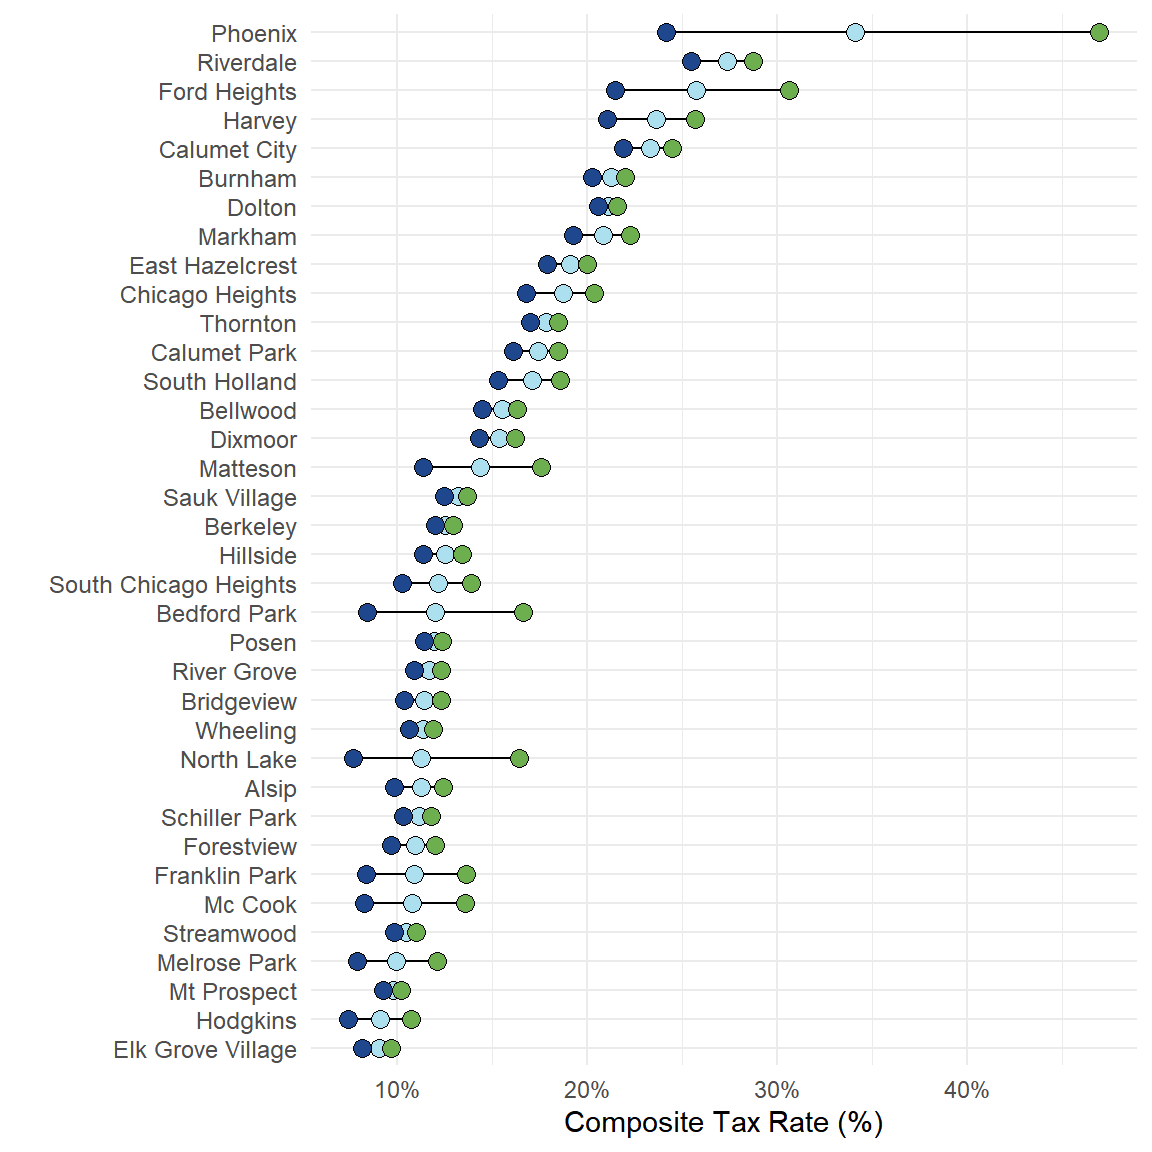
Figure 13.10: Figure 9 in Incentive Report. Only shows municipalities that had more than 1/2 percentage point change in tax rate.
Code
# as a dot graph ## 
# create order of dots
order <- muni_ratechange |>  
  as_tibble() |> 
  filter(change_noInc > .005) |>
  arrange(rate_current) |>
  select(clean_name, rate_current) |> distinct()

# make dot graph
figure9_data <- muni_ratechange |> 
  mutate(lowchange = ifelse(change_noInc < 0.02, TRUE, FALSE)
         ) |>
  filter(change_noInc > .005) |>
  select(clean_name, rate_current, rate_noInc, rate_vacant, lowchange) |> 
  distinct() |>
  arrange(rate_current) |>
  pivot_longer(c("rate_current", 
                 "rate_noInc", 
                 "rate_vacant"
  ), 
  names_to = "type", values_to = "tax_rate") |> 
  inner_join(order)  |>
  mutate(dotcolor = case_when(
          type == "rate_current" ~ "#ade0ee",
          type == "rate_noInc" ~ "#1e478e",
          type == "rate_vacant" ~ "#6dae4f"
          
         ),
         dotalpha = case_when(
          lowchange == TRUE ~ .8,
          T ~ 1 ),
      dotlabel = ifelse(lowchange, 
                              paste0("<span style='color:#B3B3B3;'>", clean_name, "</span>"), 
                              clean_name)
           
           )


 label_vec <- setNames(figure9_data$dotlabel, figure9_data$clean_name)


figure9_data  |>
  ggplot(aes(x = tax_rate, y= reorder(clean_name, rate_current)))+
  geom_line(aes(group = clean_name, alpha = dotalpha))+ 
  geom_point(aes(fill=dotcolor, alpha = dotalpha ), size=3, pch = 21, color = "black")+
  theme_minimal() + 

  scale_fill_identity(  labels = c("Current Rate", 
                               "No Incentive Classes: \nLoA = 25%",
                               "Incentive Classification\nLoA = 0%")) + 
  scale_x_continuous(labels = scales::percent) +
  scale_y_discrete(labels = label_vec) + 

  labs(#title = "Composite Tax Rate Scenarios",
       #subtitle = "Ordered by Current Composite Tax Rate", 
       x = "Composite Tax Rate (%)", y = "")+
    theme( 
    legend.title = element_blank(),
    legend.position = "none",
   # legend.position = "bottom",
    plot.title.position = "plot",
    plot.background = element_rect(fill='transparent', color=NA), #transparent plot bg
    axis.text.y = ggtext::element_markdown(size = 9), # enable HTML styling in axis labels
    axis.text.y.left = ggtext::element_markdown(size = 9)

  )
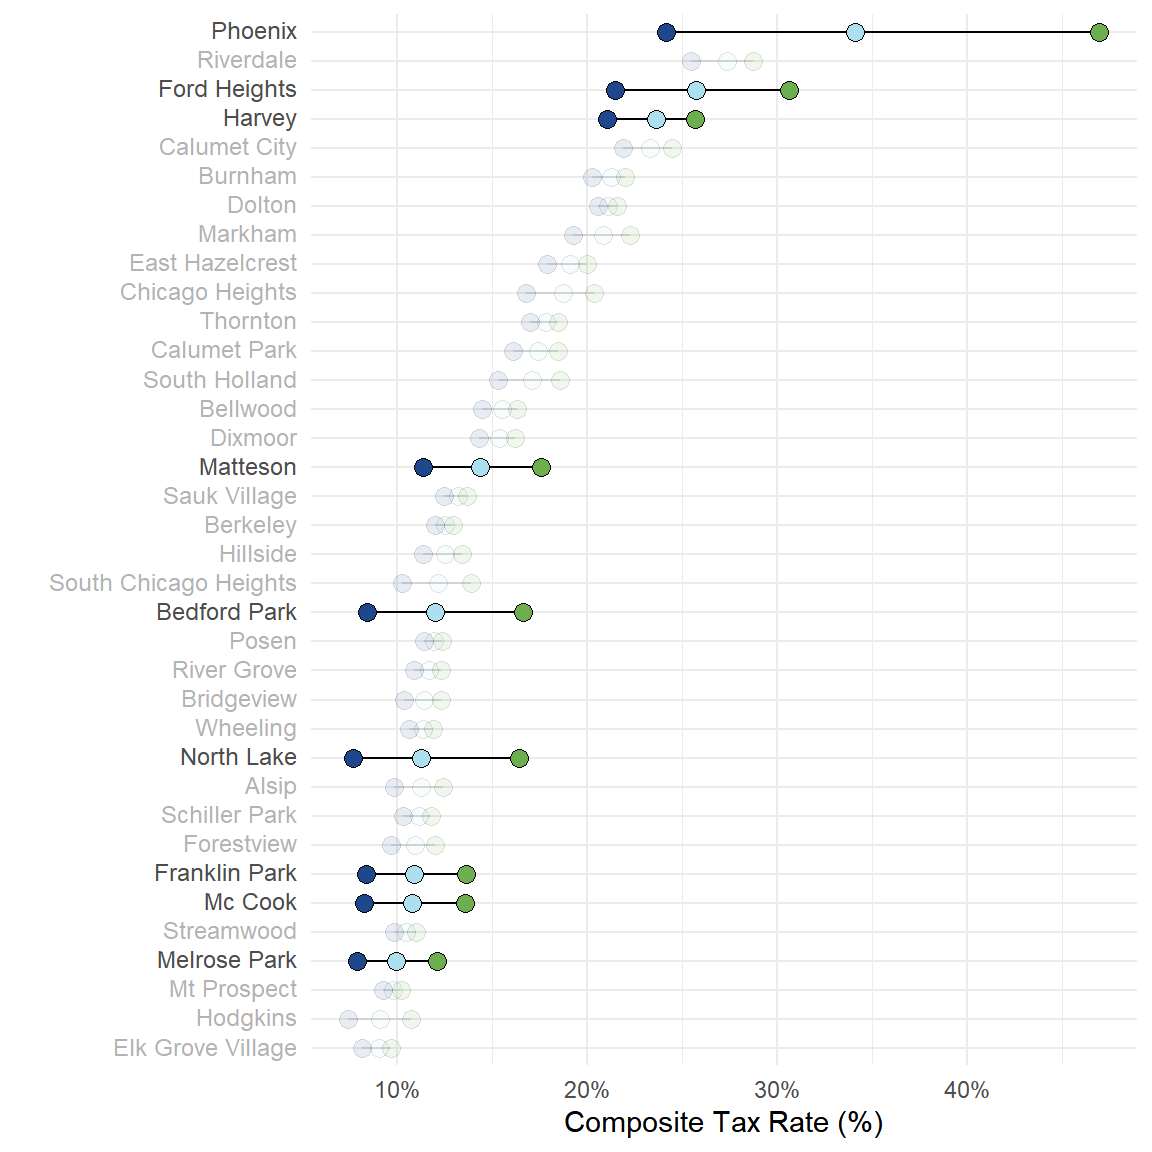
Figure 13.11: Figure 9 in Incentive Report. Only shows municipalities that had more than 1/2 percentage point change in tax rate. Municipalities with less than X amount are in grayscale.
Code
addcook <- cook_ratechange |>   
  select(rate_current, rate_noInc, rate_vacant, rate_noExe) |>
  mutate(clean_name = "Cook",
         lowchange = TRUE) |>
  select(clean_name, rate_current,rate_noInc, rate_vacant, lowchange, rate_noExe)
# as a dot graph ## 
# create order of dots
order <- muni_ratechange |>  
  as_tibble() |> 
    filter(change_noInc > .005 | clean_name == "Chicago" |  change_noExe > 0.01) |>

 # filter((change_noInc > .005 | clean_name == "Chicago" | change_noExe > 0.005) & !is.na(clean_name)) |>
  arrange(rate_current) |>
  select(clean_name, rate_current) |> distinct() |>
  rbind(addcook |> select(clean_name, rate_current))

# make dot graph
figure9_data <- muni_ratechange |> 
  mutate(lowchange = ifelse(change_noInc < 0.015 & change_noExe < 0.015, TRUE, FALSE)
         ) |>
    filter(change_noInc > .015 | clean_name == "Chicago" | clean_name == "Cook" | change_noExe > 0.015) |>

 # filter(change_noInc > .005 | clean_name == "Chicago" | clean_name == "Cook" | change_noExe > 0.01) |>

  select(clean_name, rate_current, rate_noInc, rate_vacant, lowchange, rate_noExe) |> 
  rbind(addcook) |>

  distinct() |>
  arrange(rate_current) |>
  pivot_longer(c(
                 "rate_noInc", 
                # "rate_vacant", 
                 "rate_noExe",
                "rate_current"), 
               names_to = "type", values_to = "tax_rate") |> 
  inner_join(order)  |>
  mutate(
    dotcolor = case_when(
     
      type == "rate_noInc" ~ "#ffffcc", #"#4292C6",
      #type == "rate_vacant" ~ "#6dae4f",
      type == "rate_noExe" ~ "#4292C6",
       type == "rate_current" ~ "#253494",
    ),
    dotalpha = case_when(
      lowchange == TRUE ~ .8,
      T ~ 1 ),
    dotlabel = ifelse(lowchange, 
                      paste0("<span style='color:#B3B3B3;'>", clean_name, "</span>"), 
                      clean_name)
           )

label_vec <- setNames(figure9_data$dotlabel, figure9_data$clean_name)


figure9_data  |>
  ggplot(aes(x = tax_rate, y= reorder(clean_name, rate_current)))+
  geom_line(aes(group = clean_name, alpha = dotalpha), show.legend = c(alpha = FALSE)
            )+ 
  geom_point(aes(fill=dotcolor, alpha = dotalpha ), color = "black", size=3, pch = 21, 
             show.legend = c(fill = TRUE, alpha = FALSE)
             )+
  theme_minimal() + 
  theme( 
    legend.title = element_blank(),
    #legend.position = "none",
    legend.position = "bottom",
    plot.title.position = "plot",
    plot.background = element_rect(fill='transparent', color=NA), #transparent plot bg
    axis.text.y = ggtext::element_markdown(size = 9), # enable HTML styling in axis labels
    axis.text.y.left = ggtext::element_markdown(size = 9)    
  ) +
  scale_fill_identity(labels = rev(
    c(
      "No Incentive Classes",
      "No Exemptions",
      "Current Rate")
  ),
  guide = "legend") +
  scale_x_continuous(labels = scales::percent) +
  scale_y_discrete(labels = label_vec) + 
  labs(#title = "Composite Tax Rate Scenarios",
    #subtitle = "Ordered by Current Composite Tax Rate", 
    x = "Composite Tax Rate (%)", y = "")
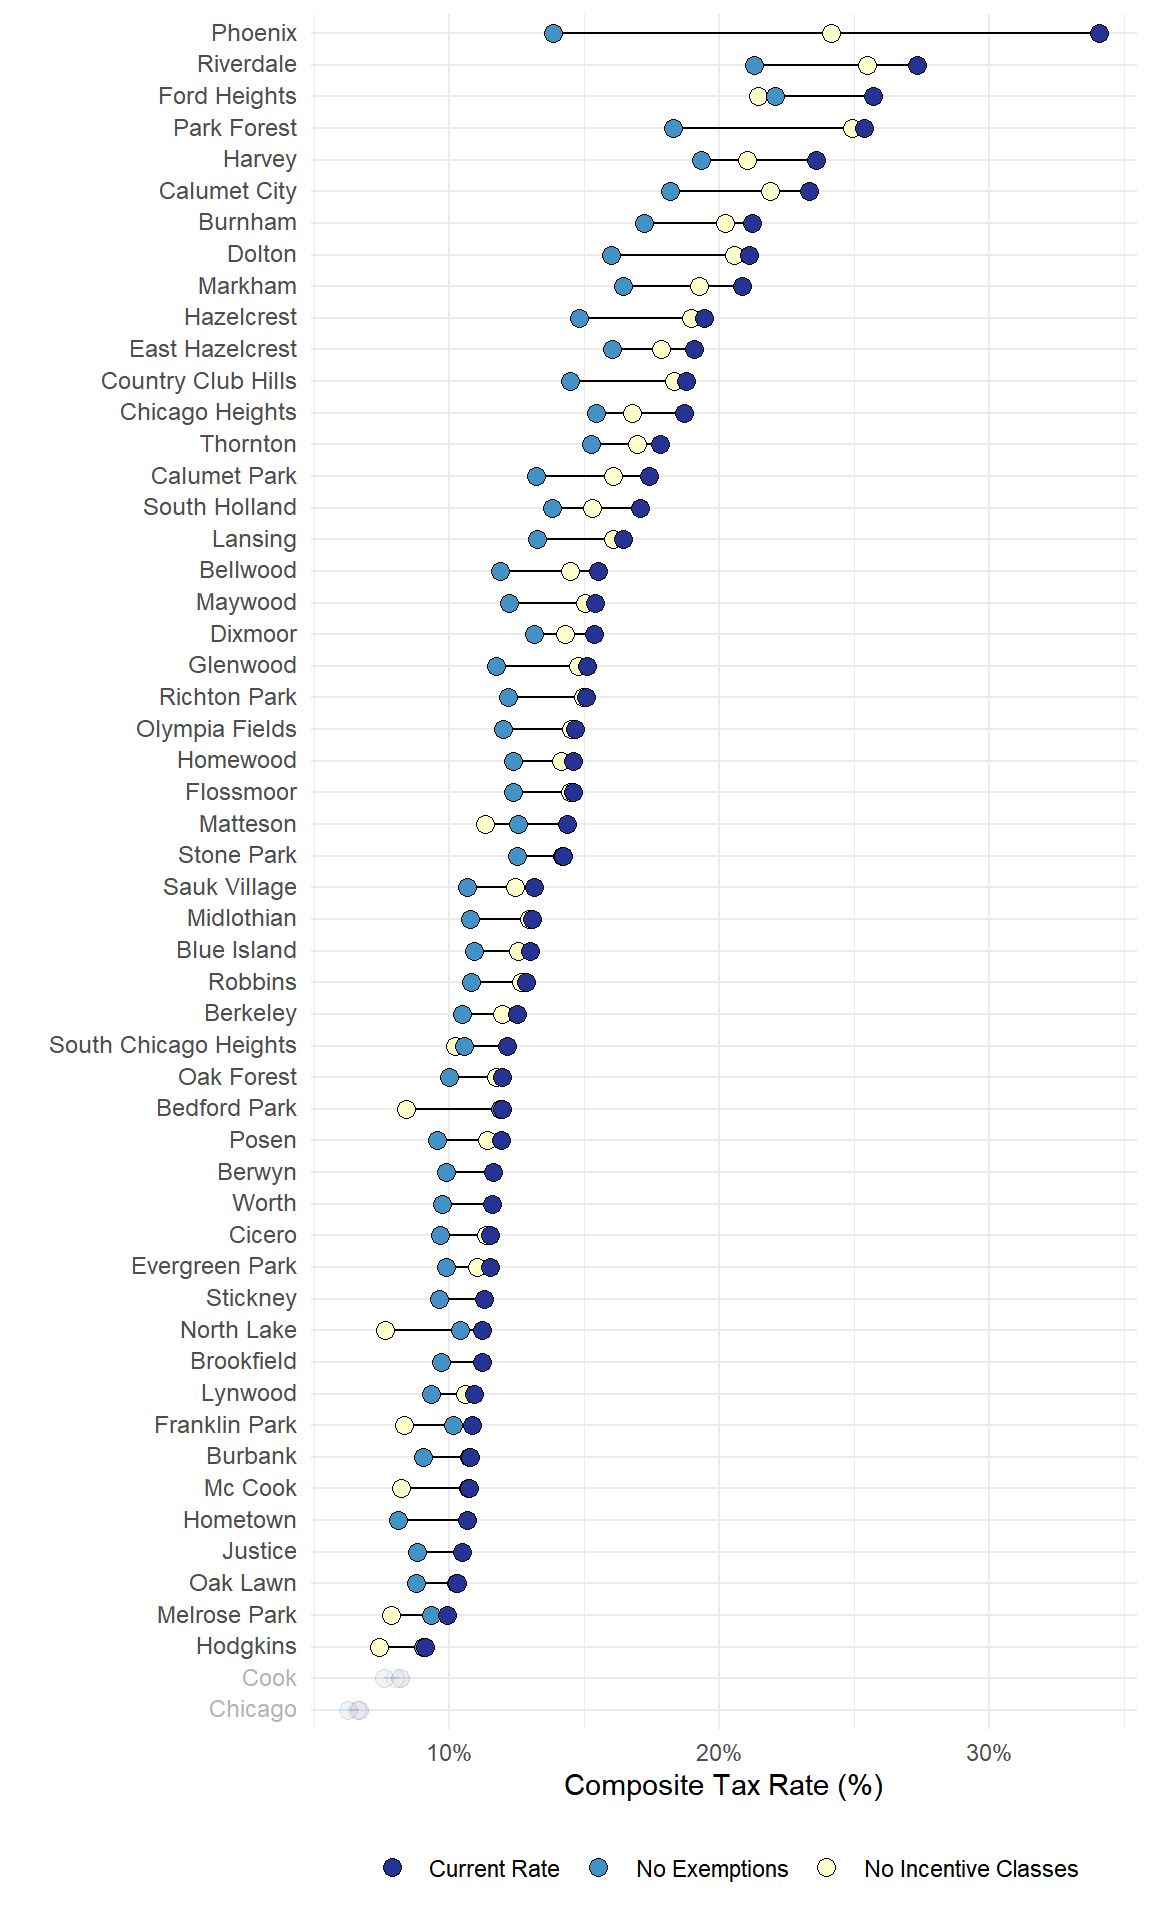
Figure 13.12: Image for Academic Paper. Only shows municipalities that had more than 1/2 percentage point change in tax rate. Municipalities with less than X amount are in grayscale.

Export Tables

Code
library(readxl)

today_date <- Sys.Date()

cook_sums <- cook_sums |>  filter(year == params$year)

cook_MC_sums <- cook_MC_sums |> filter(year == params$year)

muni_sums <- muni_sums |>  filter(year == params$year)

tablelist <- list(
  "Table1" = table1JD, # increase in comp rate due to exemptions
  "Table1_full" = table1JD_full, # increase in comp rate due to exemptions

  # "Table2" =         # FMV of incentive PINs. Separate word doc formatted for paper
  "Table3" = table3JD,   # Increase in comp rate due to incentives. Table 8 in incentive report, table 3 in JD report
  "Table3_full" = table3JD_full,   # Increase in comp rate due to incentives. Table 8 in incentive report, table 3 in JD report
  "Figure1JD_data" = Figure1JD_data,
  "Figure2JD_data" = median_exempt,
  "Figure3JD_data" = mc_burden,
  "Figure4JD_data" = figure7alt,
  "Figure5JD_data" = figure9_data,
  "Muni Stats" = muni_sums,
  "Muni Rate Change" = muni_ratechange,

  "Cook Sums" = cook_sums,
  "Cook Class Sums" = cook_MC_sums,
  "Cook Rate Change" = cook_ratechange
)

file_name = paste0("../Output/Report Content/calculations_report_content_", params$year, "_", today_date, ".xlsx")

writexl::write_xlsx(tablelist, file_name)
 
# readme <- c(
# 
#   "Muni names and share of FMV with incentive property",
#   
#   "Muni Share_all includes all municipalities and their share of FMV with incentives out of all FMV in the municipality.",
#   "IndustShare_all is same as Indust_share but includes all munis.",
#   "CommercShare_all is same as Commerc_share but includes all munis.") %>% 
#   as.data.frame()

#if(params$year == 2023){
paper_tables <- list(
  # "README"= readme,
  # Table 2 is from yearly trends.  Incentive FMV by year
  # Figure 1 is from yearly trends.  Bar Chart - Aggregate Incentive FMV by year
  # Figure 2 is from yearly trends.  Line Chart - Indexed Incentive FMV
  # Figure 3 is from yearly trends.  Line Chart - FMV for single and multi family vs C&I FMV
  # Figure 5. Line Chart - Increase in FMV indexed to 2011 for Select property types


  "Table 3" = commerc_top10,
  "Table 4" = indust_top10,
  # Table 5 is from yearly trends file

  "Figure 4" = figure7,
  "Figure 5A" = figure7B,
  "figure 5B" = figure7C,
  # Table 6 is from yearly trends file
  
  "Table 8" = table8, # if assessment ratio was 25% instead of 10%
  "Table 9" = table9, # if properties with incentives were vacant (i.e. 0 FMV)

 "Figure 9 data" = figure9_data,   # dot plot 
   # Figure X is from yearly trends. FMV Growth by Incent Class and Land Use
   # Table X is from yearly trends. Table for figure X
   # Table X+1 is from yearly trends. Change from vacant land to incentive PIN
   # Table X+2. Regression models
  "Muni Share_all" = muni_incent_share,
  "IndustShare_all" = indust_share_full,
  "Commerc_Share_all" = commerc_share_full
# "All Cook Rate Scenarios" = cook_ratechange
)


writexl::write_xlsx(paper_tables, paste0( "../Output/Incentive Report/incentive_report_tables_taxyear_", params$year, "_", today_date, ".xlsx"))

#}